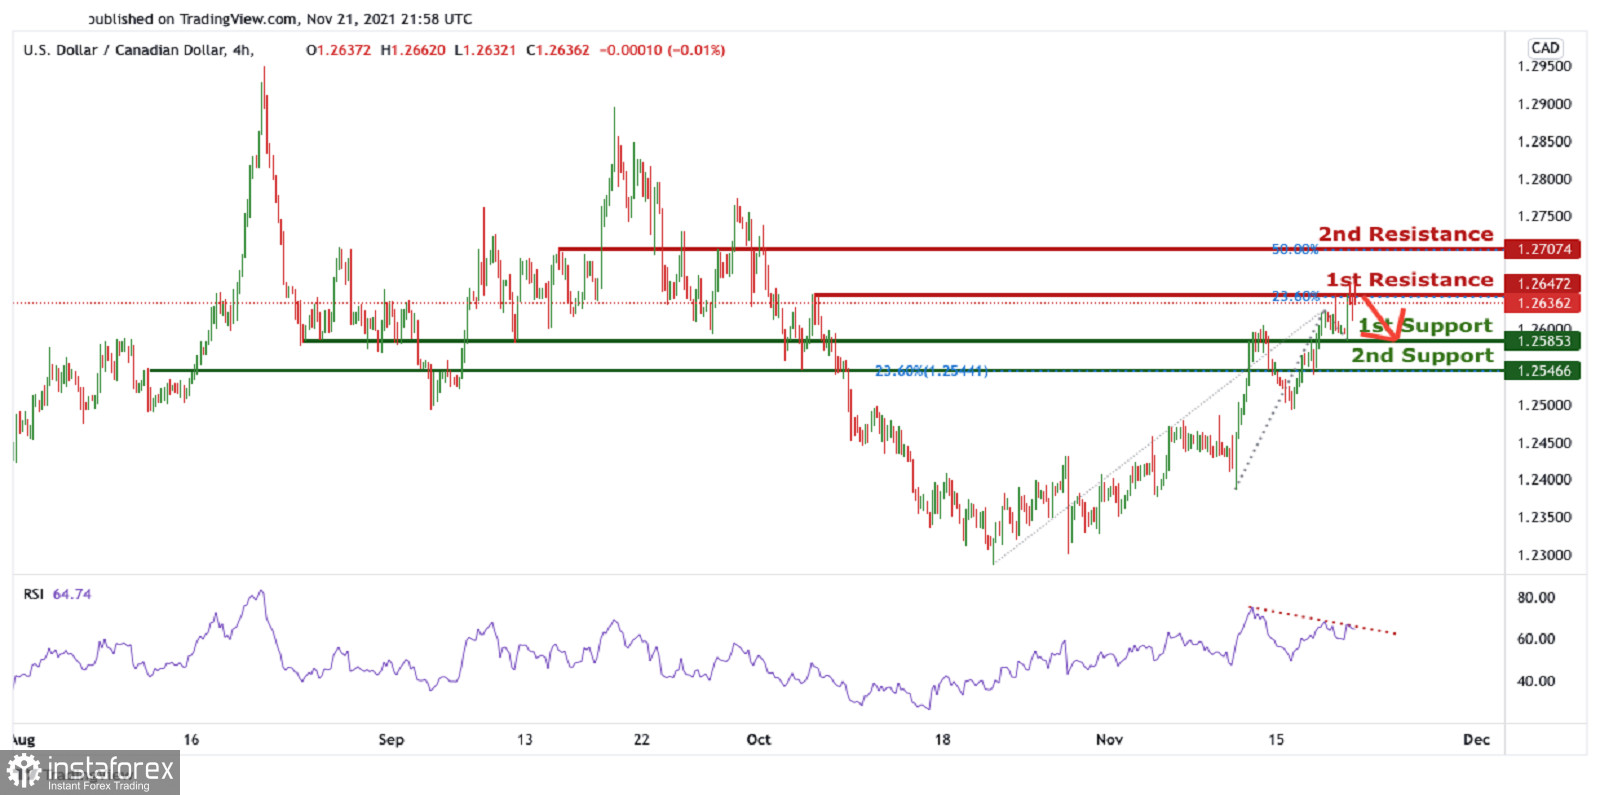
On the H4, with price reversing off the resistance on the RSI indicator and the a graphical level, we have a bearish bias that price will dip to 1st support at 1.25853 in line with the graphical overlap support and possibly to 2nd support at 1.27074 in line with the graphical overlap support from 1st resistance at 1.26472 in line with the horizontal overlap resistance and 23.6% Fibonacci retracement level. Alternatively, we may see price break 1st resistance structure and head for 2nd resistance at 1.25466 in line with the 50% Fibonacci projection retracement level and horizontal swing high resistance.
Trading Recommendation
Entry: 1.26472
Reason for Entry:
Horizontal overlap resistance and 23.6% Fibonacci retracement level
Take Profit: 1.25853
Reason for Take Profit:
Graphical overlap support
Stop Loss: 1.25466
Reason for Stop Loss:
50% Fibonacci projection retracement level and horizontal swing high resistance


