


Trend analysis (Fig. 1).
Today, a bearish trend may continue from the level of 1.0876 (closing of the Friday afternoon candle) with the first target at the lower fractal 1.0813. When this level is broken down, the continuation of the downward move is with the target at the lower fractal 1.0769 (presented in a red dashed line).
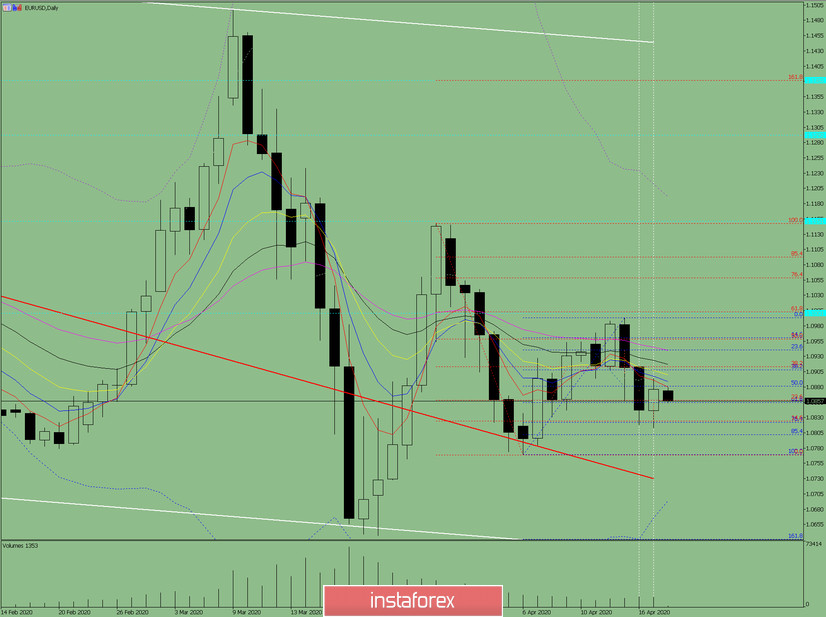
Fig. 1 (daily chart).
Comprehensive analysis:
- Indicator analysis - down;
- Fibonacci levels - down;
- Volumes - down;
- Candlestick analysis - down;
- Trend analysis - down;
- Bollinger lines - down;
- Weekly schedule - down.
General conclusion:
Today, the price may continue moving down with the target at the lower fractal 1.0769 (presented in a red dashed line).
An unlikely bullish trend is from a pullback level of 76.4% equivalent to 1.0822 (presented in a blue dashed line) with a target of 1.0913 - a 38.2% retracement level (presented in a red dashed line).


