


Trend analysis:
The price from the level of 1.2497 (closing of the last weekly candlestick) is expected to increase this week, with the first upper target of 1.2710 - a pullback level of 61.8% (red dotted line) and if this line is reached, we can further develop with a target of 1.2979 - a pullback level of 76.4% (red dashed line).
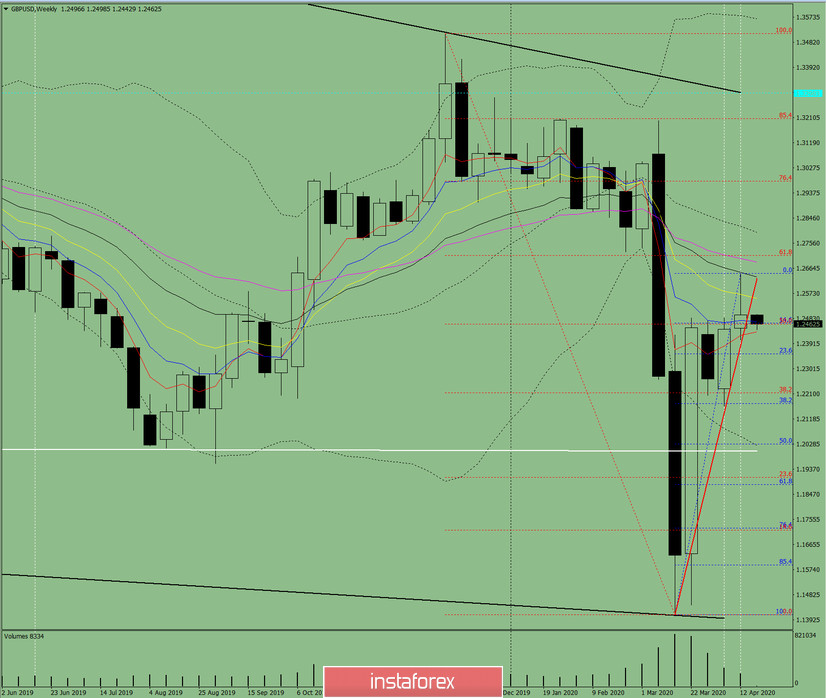
Fig. 1 (weekly schedule).
Comprehensive analysis:
- indicator analysis - up;
- Fibonacci levels - up;
- volumes - up;
- candlestick analysis - up;
- trend analysis - up;
- Bollinger lines - down;
- monthly chart - up.
The conclusion of a comprehensive analysis is an upward movement.
The total result of calculating the candle of the GBP/USD currency pair according to the weekly chart: the price of the week will most likely have an upward trend with the presence of the first lower shadow of the weekly white candlestick (Monday - down) and the absence of the second upper shadow (Friday - up).
The first upper target of 1.2710 is a pullback level of 61.8% (red dashed line).
The second upper target of 1.2779 is a pullback level of 76.4% (red dashed line).
An unlikely scenario: working down with the first target of 1.2174 - a pullback level 38.2% (blue dashed line) from the support line - 1.2464 (red bold line) is unlikely.


