


To open long positions on EURUSD, you need:
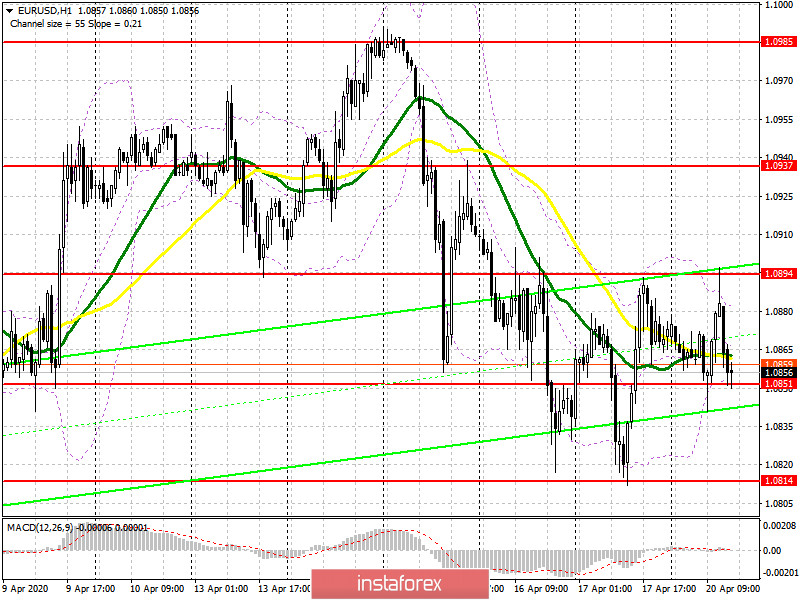
Weak statistics on German producer prices, which declined in March this year more significantly than analysts expected, led to a decline in the euro in the first half of the day. Then the bulls tried to regain control of the market, however, they failed to break above Friday's maximum. As a result of these manipulations, the technical picture remained the same. Only the nearest support and resistance levels have changed. The formation of a false breakout in the support area of 1.0851 will be a signal to open long positions in the expectation of continued growth of EUR/USD to the resistance of 1.0894, above which it was not possible to breakthrough. A break in this range will open a direct path to the maximum of 1.0937, where I recommend fixing the profits. If there is no demand for the euro around 1.0851, it is best to postpone long positions until the test of last week's low of 1.0814 or buy EUR/USD immediately on the rebound from the April low of 1.0770.
To open short positions on EURUSD, you need:
Sellers tried to resume pressure on the euro, but there was no significant movement to the level of 1.0814 in the first half of the day. However, the bulls also failed to reach the resistance of 1.0905, which led to the formation of the level of 1.0894. The primary task of the bears for the second half of the day will be a breakout and consolidation below the support of 1.0851, which will lead to a larger movement to the area of 1.0814, and then to a descent to the area of the April minimum of 1.0770, where I recommend fixing the profits. However, given the fact that no important fundamental statistics were planned for the North American session, and at the end of last week, active purchases of the euro were observed each time during this period, it is best to return to short positions on growth only after another false breakdown in the resistance area of 1.0894 or sell EUR/USD immediately on the rebound from the maximum of 1.0937.
Signals of indicators:
Moving averages
Trading is conducted in the area of 30 and 50 daily moving averages, which indicates a serious confrontation between buyers and sellers.
Note: The period and prices of moving averages are considered by the author on the hourly chart H1 and differ from the general definition of the classic daily moving averages on the daily chart D1.
Bollinger Bands
A break of the lower border in the area of 1.0851 will return pressure on the European currency.
Description of indicators
- Moving average (moving average determines the current trend by smoothing out volatility and noise). Period 50. The graph is marked in yellow.
- Moving average (moving average determines the current trend by smoothing out volatility and noise). Period 30. The graph is marked in green.
- MACD indicator (Moving Average Convergence / Divergence - moving average convergence / divergence) Fast EMA period 12. Slow EMA period 26. SMA period 9
- Bollinger Bands (Bollinger Bands). Period 20


