


Trend analysis (Fig. 1).
Today, the bearish trend may continue from the level of 1.2446 (closing of yesterday's candle) with the first target of 1.2356 - a 23.6% retracement level (presented in a blue dashed line). If this level is broken down, the price may continue to move down with the target of 1.2175 - a 38.2% retracement level (presented in a blue dashed line).
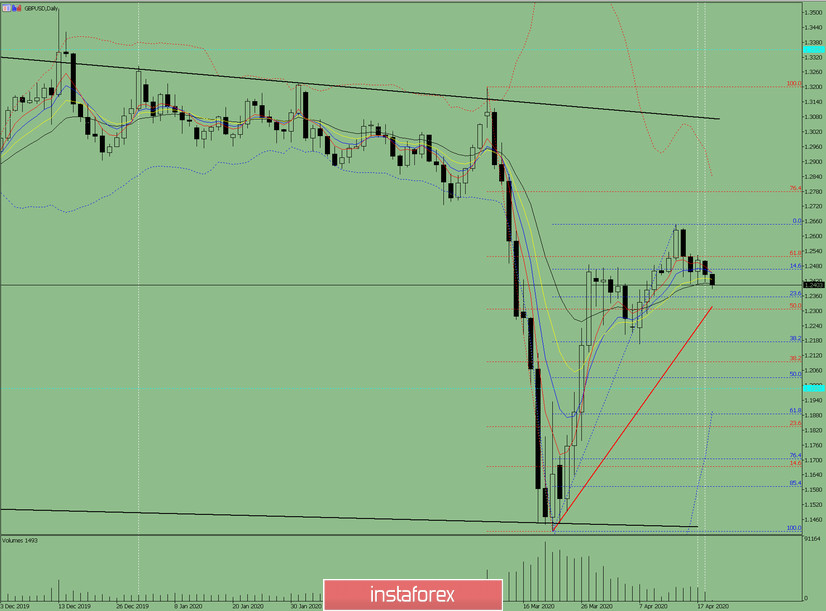
Fig. 1 (daily chart).
Comprehensive analysis:
- Indicator analysis - down;
- Fibonacci levels - down;
- Volumes - down;
- Candlestick analysis - down;
- Trend analysis - down;
- Bollinger Lines - up;
- Weekly schedule - down.
General conclusion:
Today, the price may continue to move down with the target at 1.2175 - a 38.2% retracement level (presented in a blue dashed line).
An unlikely bullish trend from 1.2356 - a 23.6% retracement level (presented in a blue dashed line) with a target of 1.2518 - a 61.8% retracement level (presented in a red dashed line). In case of breaking this level upward, the price may continue to move upward with the target at the upper fractal 1.2648 (presented in a blue dashed line).


