


To open long positions on EURUSD, you need:
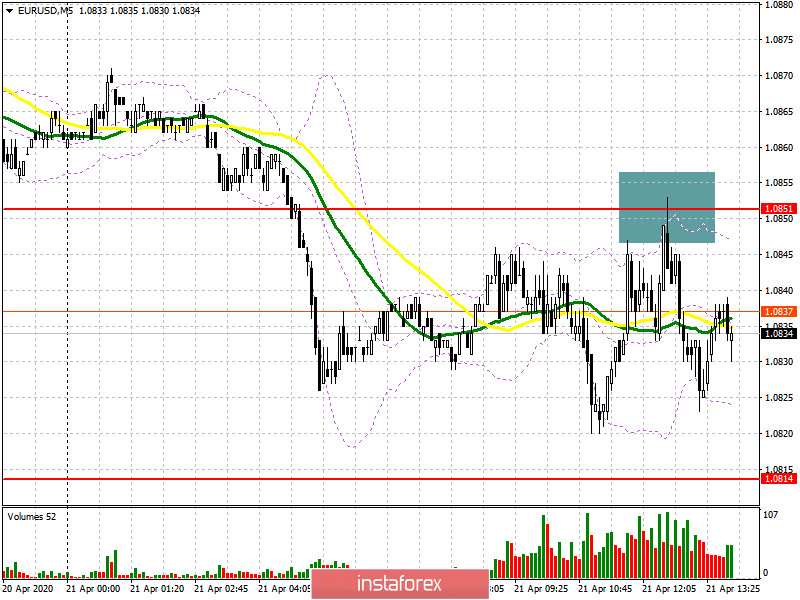
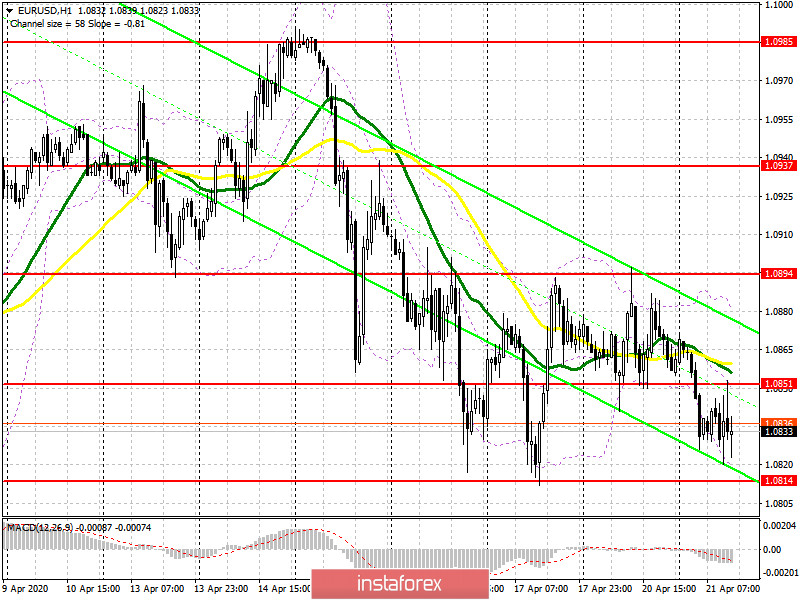
In the first half of the day, the improvement in the business environment in Germany and the Eurozone led to an attempt to strengthen the European currency, but it was not possible to cope with the resistance level of 1.0851, which I drew attention to in my morning forecast. At the moment, given that the bears continue to control the market, nothing has changed from a technical point of view. Bulls still need to regain the resistance of 1.0851 as soon as possible, which will be a signal to buy in the expectation of updating the upper border of the side channel of 1.0894, where I recommend fixing the profits. If the pressure on the euro continues in the second half of the day, then you can only expect to buy if a false breakout is formed near the lower border of the channel 1.0814, which is where sellers are now aiming. Otherwise, it is best to open long positions immediately on a rebound from the April low of 1.0770.
To open short positions on EURUSD, you need:
Sellers of the euro coped with the morning task and achieved the formation of a false breakout in the resistance area of 1.0851, which is clearly visible on the 5-minute chart. It is in this scenario that I recommended opening short positions in the pair in my morning forecast. At the moment, while trading is below the range of 1.0851, we can expect a further decline based on the third test of the lower border of the side channel of 1.0814. A break in this area will lead to a larger sale of EUR/USD, opening a direct path for it to the April low of 1.0770, where I recommend fixing the profits. If the demand for the euro remains above the resistance of 1.0851, and this will happen only if there is good news on the fight against coronavirus, since the release of important fundamental statistics is not planned for today, then it is best to return to short positions to rebound from the maximum of 1.0894.
Signals of indicators:
Moving averages
Trading is below the 30 and 50 daily moving averages, which indicates a further decline in the euro in the short term.
Note: The period and prices of moving averages are considered by the author on the hourly chart H1 and differ from the general definition of the classic daily moving averages on the daily chart D1.
Bollinger Bands
If the pair grows in the second half of the day, it is best to return to short positions only on the rebound from the upper border of the indicator in the area of 1.0880.
Description of indicators
- Moving average (moving average determines the current trend by smoothing out volatility and noise). Period 50. The graph is marked in yellow.
- Moving average (moving average determines the current trend by smoothing out volatility and noise). Period 30. The graph is marked in green.
- MACD indicator (Moving Average Convergence / Divergence - moving average convergence / divergence) Fast EMA period 12. Slow EMA period 26. SMA period 9
- Bollinger Bands (Bollinger Bands). Period 20


