


The pair traded on the lower side of the trading range on Wednesday and once again failed to break the pullback level of 74.6% - 1.0822 (presented in a blue dotted line). Today, the downward movement may continue. Economic calendar news for the euro is expected at 07:30 UTC, and for the dollar at 12:30 and 14:00 UTC. The EU leaders are set to discuss a $ 2.2 trillion recovery plan. The probability of the impact of the calendar news on the price movements is very high.
Trend analysis (Fig. 1).
Today, the bearish trend is likely to continue from the level of - 1.0825 (closing of yesterday's candle) with the first target at the lower fractal 1.0813. When this level is broken down, the price may continue to move downward with the target at the next lower fractal 1.0769 (presented in a red dashed line).
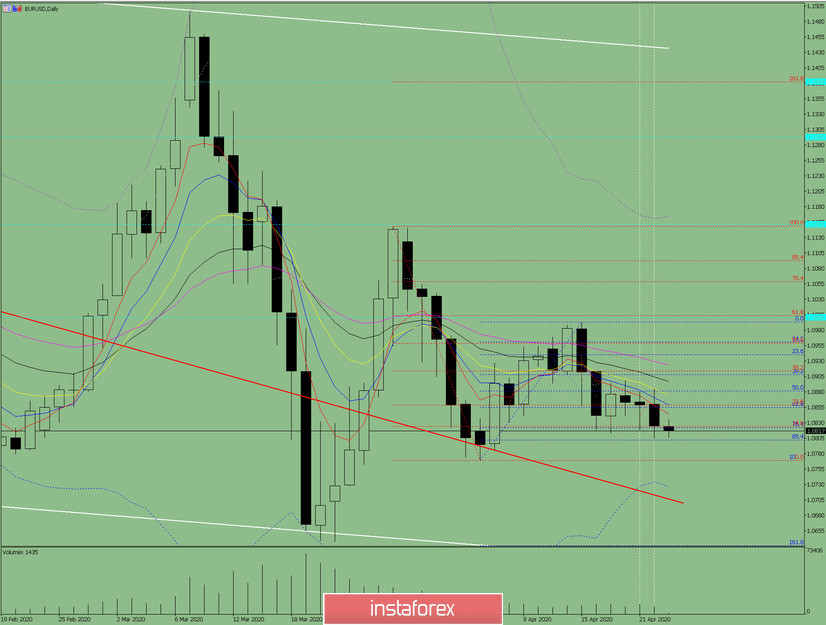
Fig. 1 (daily chart).
Comprehensive analysis:
- Indicator analysis - down;
- Fibonacci levels - down;
- Volumes - down;
- Candlestick analysis - down;
- Trend analysis - down;
- Bollinger lines - down;
- Weekly schedule - down.
General conclusion:
Today, the price may continue to move downward with the target at the lower fractal 1.0769 (presented in a red dashed line).
Another possible scenario is a bullish trend from the level of 1.0802 - an 85.4% pullback level (presented in a blue dashed line) with the target at 1.0913 - a 38.2% pullback level (presented in a red dashed line), but this scenario is possible only with good news for the euro.


