


To open long positions on EURUSD, you need:
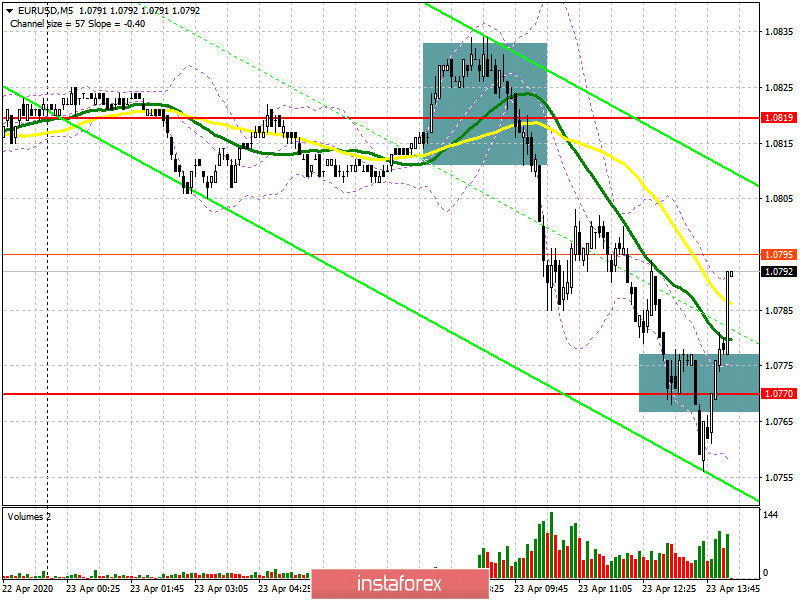
Today, the European currency quite predictably collapsed against the US dollar after the release of a number of reports indicating a sharp reduction in economic activity in the Eurozone. The services sector suffered the most. Back in the morning review, I recommended opening short positions after forming a false breakout in the resistance area of 1.0819, which happened. This is clearly visible on the 5-minute chart, where the activity of buyers appeared only after updating the minimum of 1.0770. At the moment, the bulls will focus on holding this level, since only in this scenario can we expect an upward correction to the resistance area of 1.0819, where I recommend fixing the profits. All hope for the EU summit and for good news on the allocation of a new package of assistance to fight the consequences of the crisis. In the scenario of a further decline in EUR/USD in the second half of the day, which is more likely to be true, it is best to consider new long positions around the minimum of 1.0718 in the expectation of correction of 30-40 points within the day.
To open short positions on EURUSD, you need:
Sellers coped well with the morning task and continued the fall of the euro, as I discussed in detail in my review. After reaching the support of 1.0770, the bears retreated from the market, which led to a slight rebound of the pair up. However, as we can see on the chart, it seems that the sellers are not going to stop. Bad news on the US labor market and economic activity in the US, along with the failed EU summit, will definitely hit the euro's positions, which will lead to a repeat test of the minimum of 1.0770 and to its breakdown. After that, you can count on updating the support of 1.0718 and returning EUR/USD to the minimum of March this year (1.0636), where I recommend fixing the profits. In the scenario of an upward correction of the pair in the second half of the day, you can return to short positions only after the formation of another false breakout from the resistance of 1.0819 or sell the euro immediately on a rebound from the maximum of 1.0853.
Signals of indicators:
Moving averages
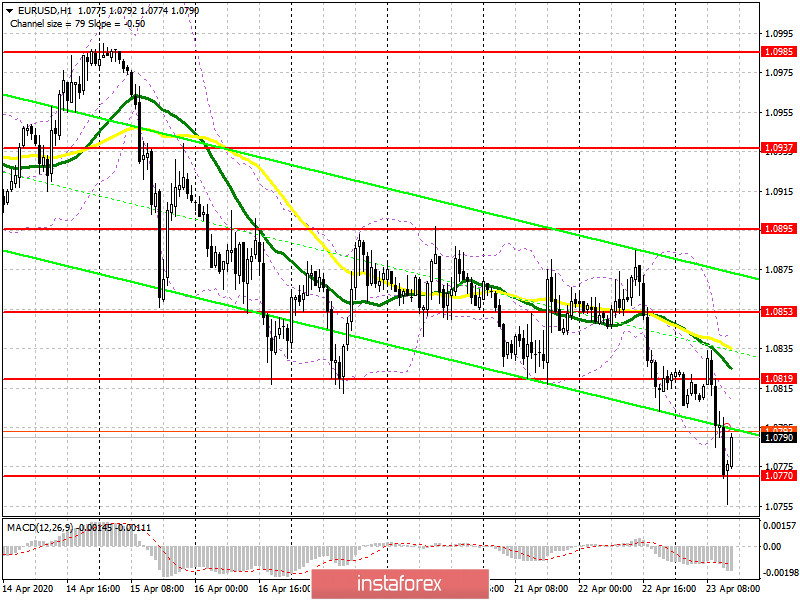
Trading is below the 30 and 50 daily moving averages, which indicates a further fall in the euro.
Note: The period and prices of moving averages are considered by the author on the hourly chart H1 and differ from the general definition of the classic daily moving averages on the daily chart D1.
Bollinger Bands
In the case of an upward correction, the upper limit of the indicator around 1.0840 will act as a resistance.
Description of indicators
- Moving average (moving average determines the current trend by smoothing out volatility and noise). Period 50. The graph is marked in yellow.
- Moving average (moving average determines the current trend by smoothing out volatility and noise). Period 30. The graph is marked in green.
- MACD indicator (Moving Average Convergence / Divergence - moving average convergence / divergence) Fast EMA period 12. Slow EMA period 26. SMA period 9
- Bollinger Bands (Bollinger Bands). Period 20


