


Trend analysis (Fig. 1).
Today, the upward pullback of the pair is likely to continue towards the lower fractal 1.2247 (presented in a red dashed line) with the first target of 1.2399 - a 38.2% retracement level (presented in a red dashed line). In case of breaking this level up, the price may continue to move upward with the target of 1.2447 - a 50.0% rollback level (presented in a red dashed line).
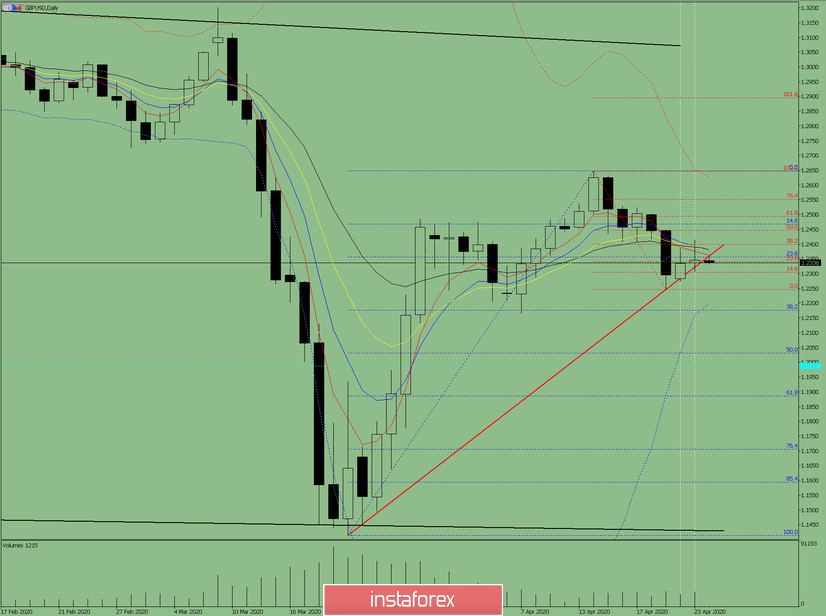
Fig. 1 (daily chart).
Comprehensive analysis:
- Indicator analysis - up;
- Fibonacci levels - up;
- Volumes - up;
- Candlestick analysis - down;
- Trend analysis - up;
- Bollinger Lines - up;
- Weekly schedule - up.
General conclusion:
Today, the price may continue to move downward with the target at the lower fractal 1.2247 (presented in a red dashed line). In case of breaking through this level, the price may begin to move upward with the first target of 1.2399 - a 38.2% retracement level (presented in a red dashed line).
Another possible scenario is a bearish trend from the lower fractal 1.2247 (presented in a red dashed line) with the target of 1.2176 - a 38.2% retracement level (presented in a blue dashed line). If this level is broken down, the price may continue to move downward with the target of 1.2031 - a 50.0% rollback level (presented in a blue dashed line). This scenario is only possible with negative news for the pound.


