


Trend analysis (Fig. 1).
Today, the upward trend may continue from the level of 1.0824 (closing of the Friday afternoon candle) with the first target at 1.0860 - a 50.0% pullback level (presented in a blue dashed line). When this level is broken up, the price may continue to move upward with the target of 1.0892 - a 61.8% retracement level (presented in a blue dashed line). Upon reaching this level, the price is most likely to roll back down.
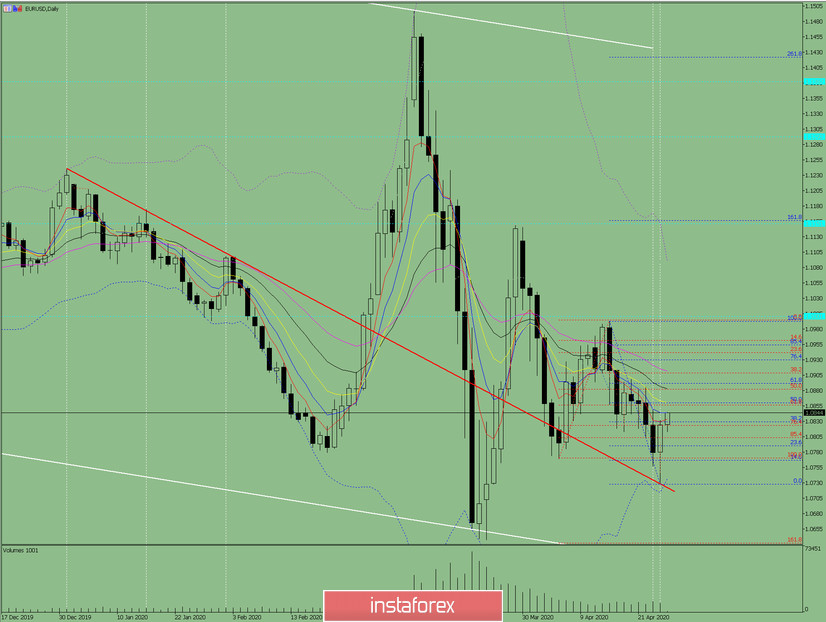
Fig. 1 (daily chart).
Comprehensive analysis:
- Indicator analysis - up;
- Fibonacci levels - up;
- Volumes - up;
- Candlestick analysis - up;
- Trend analysis - down;
- Bollinger lines - down;
- Weekly schedule - up.
General conclusion:
Today the price may continue to move upward with the target at 1.0892 - a 61.8% retracement level (presented in a blue dashed line).
Another possible scenario is a bullish trend from 1.0860 - a 50.0% pullback level (presented in a blue dashed line) with a target of 1.0804 - an 85.4% pullback level (presented in a red dashed line).


