


To open long positions on GBPUSD, you need:
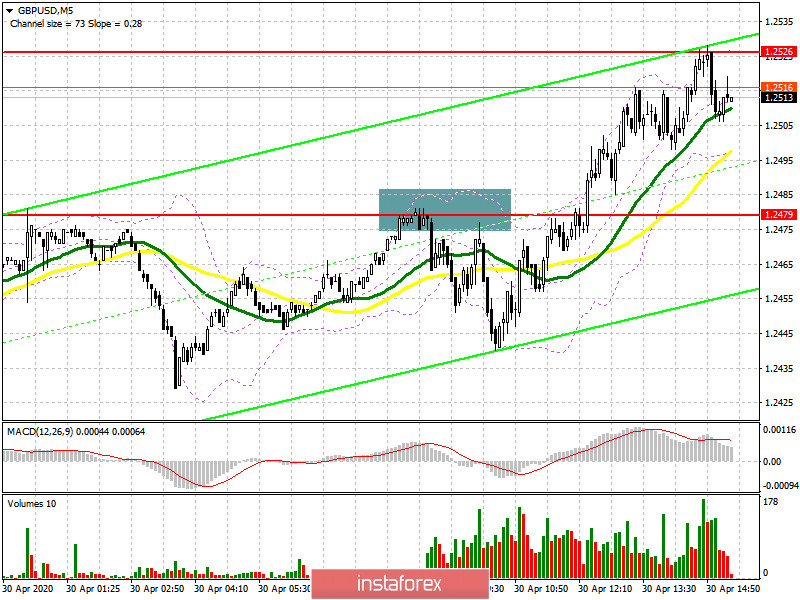
If we look at the 5-minute chart, we can see how the bears form a false breakout at the level of 1.2479 in the first half of the day and begin to gradually push the market down. However, the movement of more than 30 points does not work. Then the bulls repeatedly return the pair to the resistance of 1.2479 and breakthrough it on the third time, forming a good upward momentum to the maximum area of 1.2526, where I recommended taking the profit in the morning. At the moment, the task of buyers of the British pound is to build a good base around the level of 1.2526, the breakdown of which in the second half of the day will lead to the growth of the pair to the highs of 1.2573 and 1.2632, where I recommend closing long positions. In the scenario of a decline in GBP/USD, it is best to return to purchases only after a correction and if a false breakout is formed from the support of 1.2479. You can only open long positions immediately on a rebound from the weekly low of 1.2392.
To open short positions on GBPUSD, you need:
Bears tried several times to take the market under their control, forming false breakouts at the level of 1.2479, but after the third test of this area, they moved away, showing themselves only at the update of a new high of 1.2526. While trading is below this level, there is a high probability of the pound returning to the support of 1.2479, but it is best to wait for another unsuccessful attempt to grow above the resistance of 1.2526 with the formation of a false breakout after a number of reports on the state of the US labor market. If there is no buying activity in the area of 1.2479, bears can very quickly dump the pound to a minimum of 1.2392, where I recommend fixing the profits. In the scenario of further growth of GBP/USD on the trend above the resistance of 1.2526, you can sell for a rebound from the maximum of 1.2573 in the calculation of correction of 30-40 points within the day.
Signals of indicators:
Moving averages
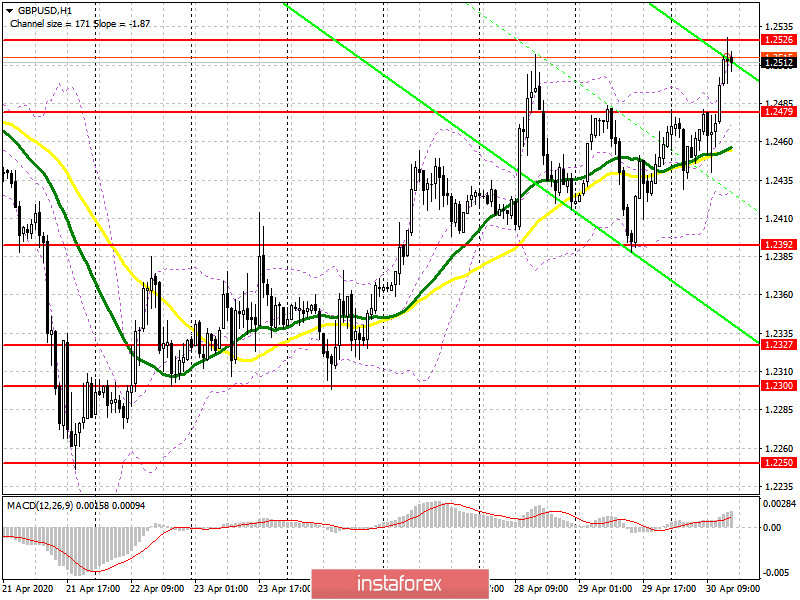
Trading is conducted above the 30 and 50 daily averages, which indicates a continuation of the bullish trend.
Note: The period and prices of moving averages are considered by the author on the hourly chart H1 and differ from the general definition of the classic daily moving averages on the daily chart D1.
Bollinger Bands
In the case of a downward correction, you can open long positions on a rebound from the lower border of the indicator around 1.2420.
Description of indicators
- Moving average (moving average determines the current trend by smoothing out volatility and noise). Period 50. The graph is marked in yellow.
- Moving average (moving average determines the current trend by smoothing out volatility and noise). Period 30. The graph is marked in green.
- MACD indicator (Moving Average Convergence / Divergence - moving average convergence / divergence) Fast EMA period 12. Slow EMA period 26. SMA period 9
- Bollinger Bands (Bollinger Bands). Period 20


