


Good day, dear traders!
Today, on the last day of weekly trading, we will again analyze the interesting cross-rate of the euro/pound, and pay special attention to the technical picture. Especially since the market closed April yesterday.
Monthly
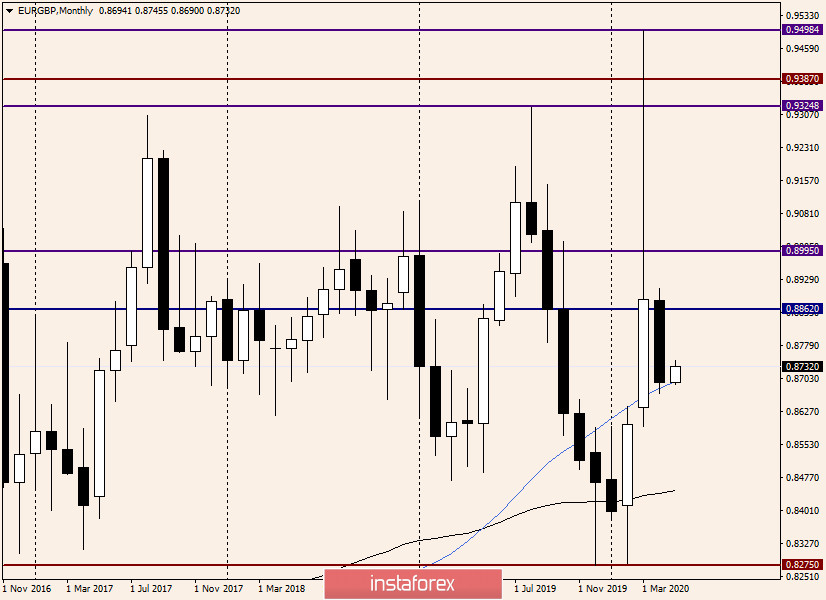
We must admit that the results of April trading, during which the pair declined, were quite expected. The extremely long shadow of the March candle pointed very eloquently to the bearish scenario of last month's trading. This is not often seen!
The decline was stopped by the 50 simple moving average, and the first day of May trading, the cross is strengthened from 50 MA. I venture to assume that this is a corrective pullback to the decline shown last month, and it will last until about the middle of the bearish body of the previous candle. If this assumption is correct, we will look for points to open short positions on lower timeframes.
Weekly
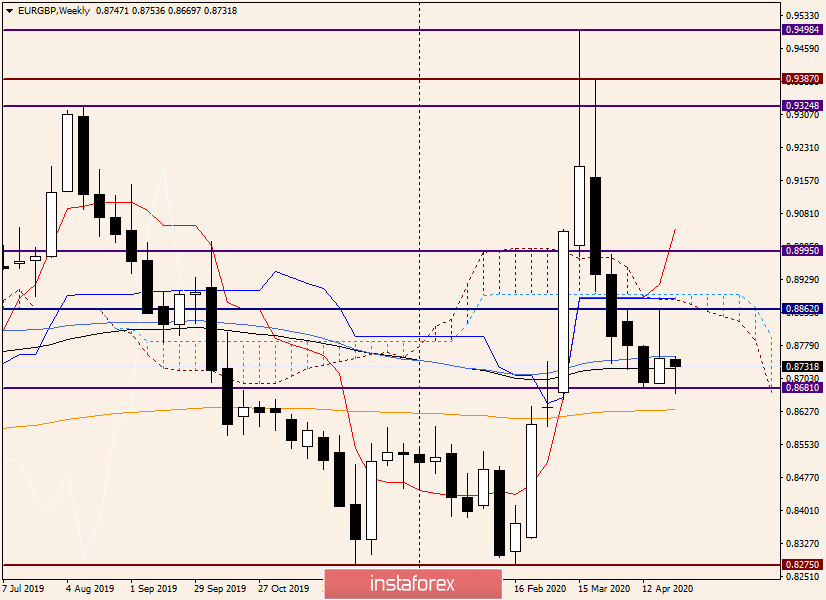
An interesting picture is drawn on the weekly chart. After the appearance of the last bullish candle with a very long upper shadow, the cross bears decided to take advantage of the weakness of their opponents and push support to 0.8680. But that was not the case. This level turned out to be quite strong, and after its puncture, the euro/pound began to adjust, restoring the losses incurred before.
At the moment of writing, the current weekly candle has a long lower shadow, and trading is conducted between 89 exponential and 50 simple moving averages. If the week can be completed above 50 MA, we will most likely see a continuation of the eur/gbp rise towards the resistance level of 0.8862. In a more optimistic scenario, there will be attempts to break this mark, which will nullify the lower border of the cloud and the Kijun line of the Ichimoku indicator, which are slightly higher.
I assume that if the cross gets to the area of 0.8860-0.8880, it is worth considering sales from here. A bearish candlestick pattern formed in the designated zone will confirm the opening of short positions.
Daily
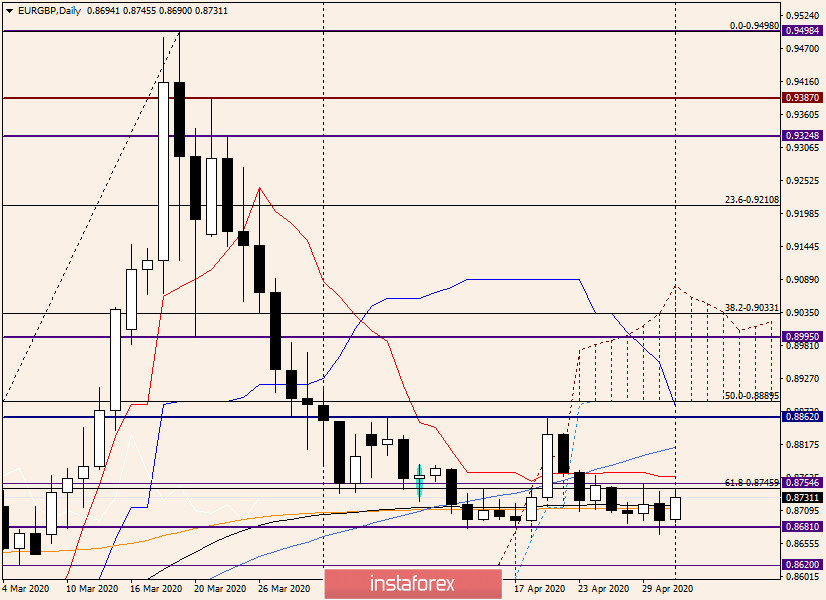
On the daily chart, there is a consolidation in the range of 0.8755-0.8670. It is reasonable to assume that the exit from this range will indicate the near-term prospects for the price movement of the euro/pound.
However, given that the Tenkan line is located at 0.8766, the breakdown of the upper limit of the range of 0.8755 may turn out to be false, after which the cross will turn in the south direction. But even if the Tenkan is passed, the resistance should be expected from 50 MA, which is located at 0.8814.
Conclusion and trading recommendations for EUR/GBP:
We must admit that the overall technical picture for this tool is far from unambiguous, especially in the context of the topical topic COVID-19. Nevertheless, I think the main trading idea for the euro/pound is selling after rising to the area of 0.8755-0.8765. I recommend considering higher and more attractive prices for opening short positions after the appearance of bearish candlestick reversal signals in the area of 0.8800-0.8860.
At the same time, at the moment, it is quite possible to continue growth, so it is necessary to consider options for purchases. Aggressive and risky, you can try to buy from current prices. It is less risky to wait for a pullback to the price zone of 0.8727-0.8707 and after the appearance of bullish candles there, buy a pair with the nearest goals in the area of 0.8760. I hope you understand that this forecast is not intended exclusively for today.
Have a nice weekend!


