


Trend analysis.
An upward movement is possible in May, with the first goal of 1.1110 - a pullback level of 50.0% (blue dashed line). In case of breaking this line up, the next goal will be 1.1200 - a pullback level of 61.8% (blue dashed line). It is possible to work down from this level with the first target of 1.1103 - 13 average EMA (yellow thin line).
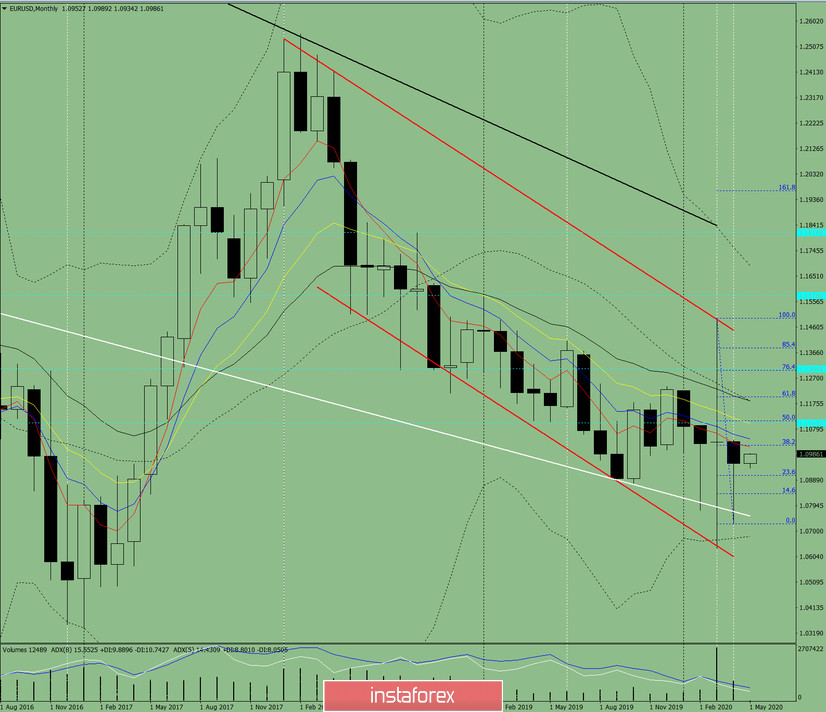
Fig. 1 (monthly chart).
Indicator Analysis:
- indicator analysis - up;
- Fibonacci levels - up;
- volumes - up;
- candlestick analysis - up;
- trend analysis - up;
- Bollinger lines - down;
The conclusion of a comprehensive analysis is most likely the top work.
The total result of calculating the candle of the EUR/USD currency pair according to the monthly chart: the price will most likely have an upward trend with the absence of the first lower shadow (the first week of the month is the upper one) and the absence of the second upper shadow (the last week is white).
An upper scenario: the upper target of 1.1200 is a pullback level of 61.8% (presented in a blue dashed line) from the level of 1.0953 (closing of the April monthly candle).
An unlikely lower scenario: working down with the target at 1.0755 - support line (presented in a white bold line) from the level of 1.0953 (closing of the April monthly candle) is unlikely.


