


Last week, the pair started moving up from the support line 1.2364 (red bold line) and tested the 21 average EMA - 1.2612 (black thin line), but then, after testing this line, the price went down by 128 points. There is a high possibility that the price may continue to decline this week.
Trend analysis.
This week, the price from the level of 1.2488 (closing of the last weekly candle) will move down with the first lower target of 1.2354 - a pullback level of 23.6% (blue dashed line), and in case of breaking down this level, we can further move down with a target of 1.2174 - a pullback level of 38.2 % (blue dashed line).
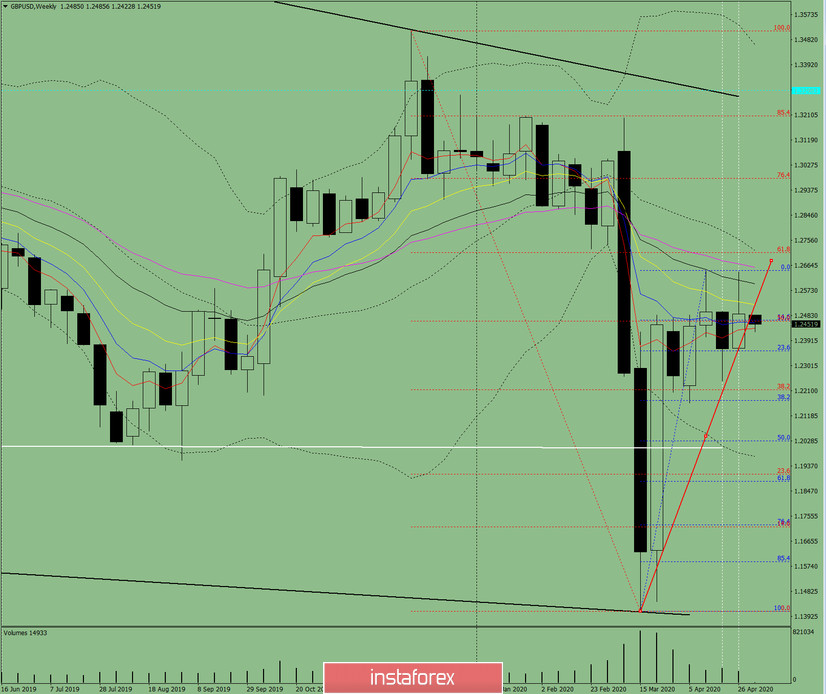
Fig. 1 (weekly schedule).
Comprehensive analysis:
- indicator analysis - down;
- Fibonacci levels - down;
- volumes - down;
- candlestick analysis - neutral;
- trend analysis - down;
- Bollinger lines - down;
- monthly chart - down.
The conclusion of a comprehensive analysis is a downward movement.
The overall result of calculating the candle of the GBP / USD currency pair according to the weekly chart: the price of the week will most likely have a downward trend with the absence of the first upper shadow of the weekly black candlestick (Monday - down) and the presence of the second lower shadow (Friday - up).
The first lower target of 1.2354 is a pullback level of 23.6% (blue dashed line).
The second lower target of 1.2174 is a pullback level of 38.2% (blue dashed line).
An unlikely scenario: the price from the pullback level of 50% - 1.2462 (red dotted line) working with the first upper target of 1.2528 - resistance line (red bold line). When this level is broken up, continue working up with the target of 1.2642 - the upper fractal (blue dotted line).


