


On Thursday, the pair first traded upward and tested the 21 average EMA at 1.2418 (presented in a black thin line), then after that, a downward pullback movement took place where the pair tested the lower border of the Bollinger line indicator at 1.2266 ( presented in a blue dashed line curve). Today, an upward trend is likely to take place. Economic calendar news for the dollar is expected at 12:30 UTC.
Trend analysis (Fig. 1).
Today, an upward trend is likely to take place from the level of 1.2363 (closing of yesterday's candle) with a target at 1.2447 - a 50% pullback level (presented in a red dashed line). If this level is reached, the price may continue to move upward with a target at 1.2495 - a 61.8% retracement level (presented in a red dashed line).
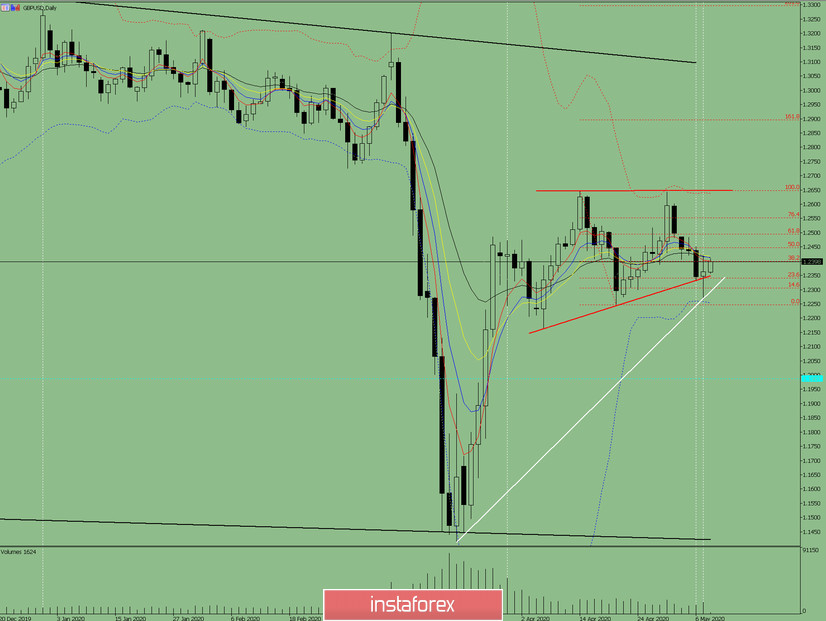
Fig. 1 (daily chart).
Comprehensive analysis:
- Indicator analysis - up;
- Fibonacci levels - up;
- Volumes - up;
- Candlestick analysis - up;
- Trend analysis - up;
- Bollinger Lines - up;
- Weekly schedule - up.
General conclusion:
Today, the price may move upward with a target at 1.2495 - a 61.8% retracement level (presented in a red dashed line).
Another possible scenario is a bearish trend from 1.2400 - a 38.2% retracement level (presented in a red dashed line) with a target at 1.2258 - the lower border of the Bollinger line indicator (presented in a blue dashed line curve).


