


Using integrated analysis, we can see that there was a V-shaped fluctuation, where activity exceeded the average daily rate.
An impressive recovery arose last Friday and almost returned the quotes to the area where the trade forces interacted on April 21. The convergence of prices within the control level led to a sharp change in trading interest, which provoked market participants to local operations. As a result, a V-shaped fluctuation was formed, where the upward course almost 100% developed downward, in the structure of the local model.
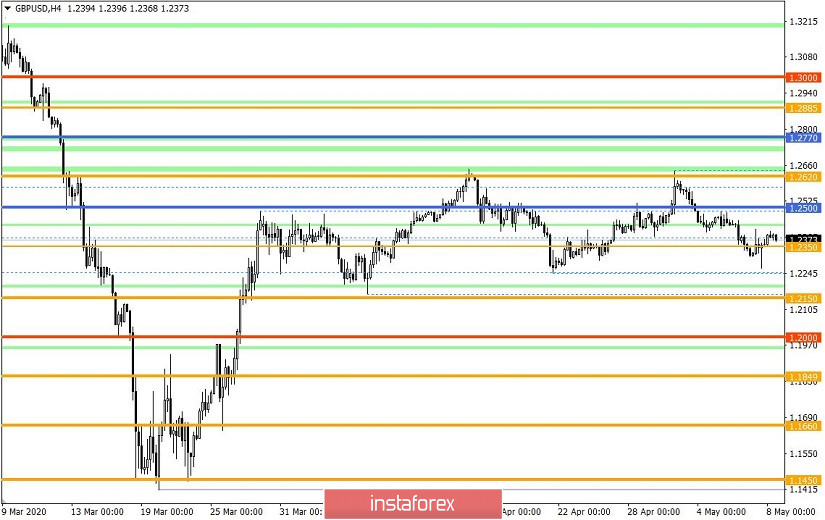
Whether the V-shaped fluctuation is a signal for the formation of an upward move is still uncertain, but yesterday we raised the topic of the side corridor 1.2150 // 1.2350 // 1.2620, which has an impressive temporal weight in the market. The 1.2250 area has already been a variable support in the existing range. Whether the market will be able to repeat the swing is still unclear, but we have this scenario and are ready for local actions.
Meanwhile, the downward position is still taken as the basis for the medium-term course. To confirm this theory, quotes must consolidate below 1.2150. Such case will form a recovery process relative to the course on March 20 to April 14.
Analyzing yesterday's trading by the minute, we can see that the downward movement in the V-shaped fluctuation occurred at 8:15-15:15 (UTC+1), in the area where trading forces also converged on April 21. Meanwhile, the upward turn took place in the period of 15:30-19:00 (UTC+1), where the quote managed to bounce by more than 100 points over a rather modest period of time.
As discussed in the previous review, traders sold positions at a price consolidation below 1.2310. Expectations were met, and the trading deposit received a small increase.
In terms of volatility, it again accelerated for the second day in a row, where this time, it was possible to exceed the average daily indicator by 16%. We also see a gradual normalization of the emotional mood of market participants. For example, the average dynamics of the daily candle for March was 189 points, while in April it was 123 points. A similar decrease is recorded for the EUR/USD pair, which can be viewed as a universal normalization of the emotional mood of the market.
Details of volatility
MARCH: Monday - 165 points; Tuesday - 245 points; Wednesday - 172 points; Thursday - 358 points; Friday - 359 points; Monday - 144 points; Tuesday - 271 points; Wednesday - 676 points; Thursday - 354 points; Friday - 522 points; Monday - 267 points; Tuesday - 296 points; Wednesday - 333 points; Thursday - 452 points; Friday - 352 points; Monday - 148 points; Tuesday - 227 points.
APRIL: Wednesday - 108 points; Thursday - 126 points; Friday - 198 points; Monday - 116 points; Tuesday - 217 points; Wednesday - 131 points; Thursday - 122 points; Friday - 42 points; Monday - 87 points; Tuesday - 146 points; Wednesday - 193 points; Thursday - 119 points; Friday - 114 points; Monday - 86 points; Tuesday - 198 points; Wednesday - 111 points; Thursday - 106 points; Friday - 78 points; Monday - 94 points; Tuesday - 113 points; Wednesday - 96 points; Thursday - 213 points.
MAY: Friday - 117 points; Monday - 82 points; Tuesday - 69 points; Wednesday - 116 points.
The average daily indicator, relative to the dynamics of volatility is 130 points [see table of volatility at the end of the article].
Yesterday's news contained the results of the Bank of England meeting, where the base rate was left at 0.1%, and the amount of quantitative easing became £645 billion, slighter higher than the forecasted £ 625 billion.
The results came out in the morning, right before the start of the European session, and the decision to maintain the amount of quantitative easing locally pushed the pound up.
After that, market emotions subsided, and the pound resumed its decline. In addition, the data on US unemployment were already published, the content of which indicated 3,169,000 initial applications and 22,647,000 repeated applications. Although the figures were anti-records, the market did not react to the statistics, and the dollar continued its rise.
Market participants already expect such figures so drastic changes to USD rates did not occur.
Meanwhile, the heads of delegation at the US-China trade talks discussed during a conference call the implementation of the first phase of the trade agreement between the two countries, which was halted due to the coronavirus outbreak. The existing negotiations are aimed at preventing the collapse of those agreements that the parties have already reached.
At the same time, there are rumors that China is planning to reduce its investment in US government bonds, as a kind of retaliatory step against Washington's accusations against Beijing regarding the concealment of the true extent of the coronavirus. Chinese investment in American securities is about $ 1.1 trillion, and a reduction in volumes could trigger a decline in the dollar.
Against this news, the US dollar weakened locally.
Today, the US Department of Labor will publish its report on US unemployment, which experts forecast a rise in unemployment rate from 4.4% to 15.5%, the highest rate in 72 years, and a reduction in employment by 21,780,000, which would be considered a historical record.

The upcoming trading week contains a number of macroeconomic data for March / April in Britain and the United States, which will continue to reflect the effects of quarantine measures on the economies of the countries.
The most interesting events are displayed below (UTC+1):
Tuesday, May 12
USA 13:30 - Inflation data for April
Wednesday, May 13
UK 07:00 - Preliminary data on 1st quarter GDP
UK 07:00 - Volume of industrial production for March
USA 13:30 - Producer Price Index (PPI) for April
Thursday, May 14
EU 05:00 - Inflation data for April in Germany
EU 10:00 - Unemployment rate for March
USA 13:30 - Applications for unemployment benefits
Friday May 15
USA 13:30 - Retail sales
Further development
As we can see in the current trading chart, there was a sluggish fluctuation, where the quote gradually decreased towards the mirror level of 1.2350. With this fluctuation, work both on local operations and on the main ones are needed, not excluding that the amplitude of past days will repeat.
Thus, we can assume that in the event of a price consolidation below 1.2350, we will see another move towards the 1.2310 mark. At the same time, a variable fluctuation within 1.2350 / 1.2420 may occur, if activity remains low.
Based on the information above, we formulated these trading recommendations:
- Open buy positions when the price consolidates above 1.2420, towards 1.2450
- Open sell positions below 1.2350, towards 1.2310, followed by positions below 1.2300, towards 1.2250.
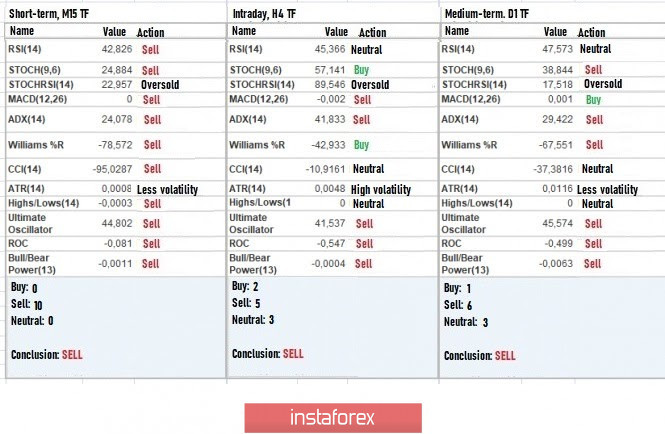
Indicator analysis
Analyzing the different sector of timeframes (TF), we see that the V-shaped model did not change the signals on the hourly and daily periods. The general mood is still downward.
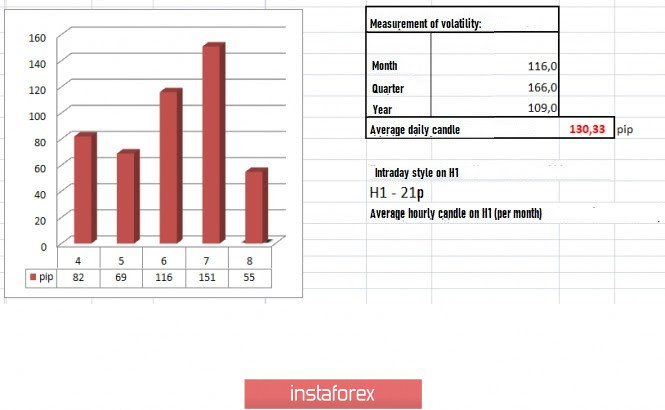
Volatility per week / Measurement of volatility: Month; Quarter; Year
The volatility measurement reflects the average daily fluctuation, calculated by Month / Quarter / Year.
(May 8 was built, taking into account the time of publication of the article)
Volatility is currently 55 points, which is considered low, relative to the average daily value. If the market reacts to the news today, activity may be recorded. If not, there may be a slowdown within the limits set above.
Key levels
Resistance Zones: 1.2500; 1.2620; 1.2725 *; 1.2770 **; 1.2885 *; 1.3000; 1.3170 **; 1.3300 **; 1.3600; 1.3850; 1.4000 ***; 1.4350 **.
Support areas: 1.2350 **; 1.2250; 1.2150 **; 1.2000 *** (1.1957); 1.1850; 1.1660; 1.1450 (1.1411); 1.1300; 1,1000; 1,0800; 1,0500; 1,0000.
* Periodic level
** Range Level
*** Psychological level
**** The article is built based on the principle of conducting a transaction, with daily adjustments


