


To open long positions on GBPUSD, you need:
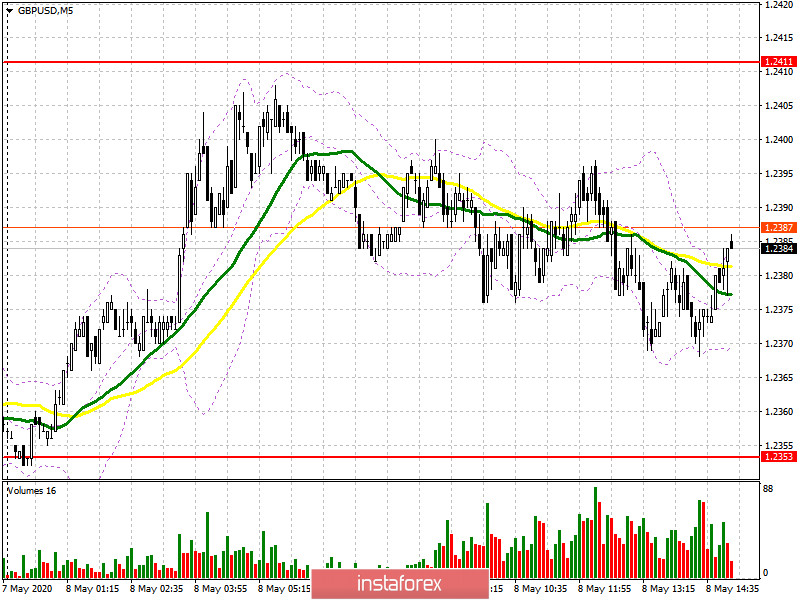
From a technical point of view, nothing has changed for traders. The pair never managed to update any of the levels that I indicated in my morning forecast, which is clearly visible on the 5-minute chart. At the moment, buyers of the pound are focused on the resistance of 1.2411, which determines the further growth of the pair. Fixing on this range in the second half of the day will be a signal to open new long positions in the expectation of continuing the correction of GBP/USD already in the area of highs 1.2446 and 1.2478, where I recommend fixing the profits. In the scenario of a pound decline after the release of the report on the American labor market, it is best to return to long positions only after the formation of a false breakdown in the support area of 1.2353, where the moving averages also go, but I recommend buying a pair immediately for a rebound only from a minimum of 1.2305, based on correction of 30-35 points within a day.
To open short positions on GBPUSD, you need:
Today, important fundamental statistics on the US labor market are published, but its impact on the pair will not be significant since the current reduction in the number of employed in the US by more than 20 million has already been taken into account in the quotes. Sellers of the pound need to protect the resistance of 1.2411, where the formation of a false breakout will be a direct signal to open short positions in the expectation of a decline in GBP/USD to the low of 1.2353. Fixing below this level will definitely lead to the demolition of a number of buyers' stop orders and collapse the pound to the areas of 1.2305 and 1.2266, where I recommend fixing the profits. If there is no activity of sellers in the resistance area of 1.2411, it is best to postpone short positions until the update of larger highs in the area of 1.2446 and 1.2478, from where you can sell immediately for a rebound in the hope of reducing the pair by 20-30 points by the end of the day.
Signals of indicators:
Moving averages
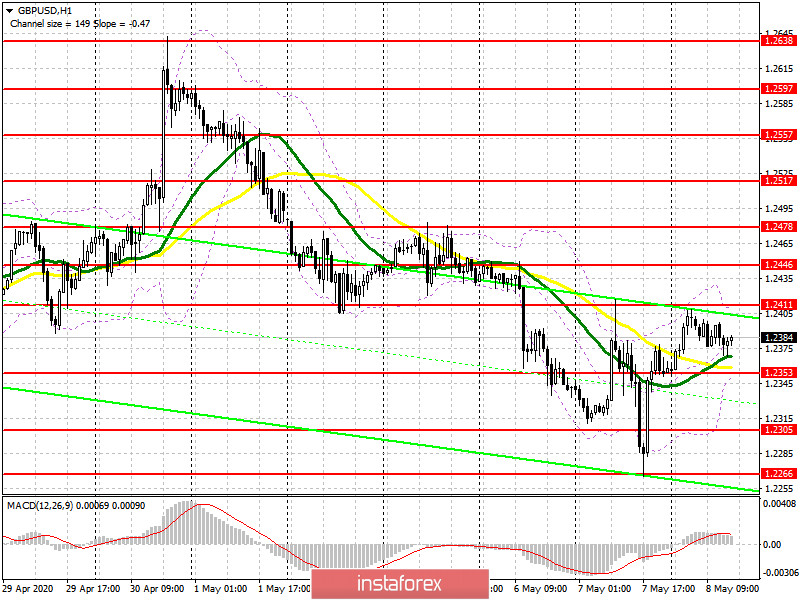
Trading is conducted above the 30 and 50 daily averages, which indicates a further probability of an upward correction of the pound.
Note: The period and prices of moving averages are considered by the author on the hourly chart H1 and differ from the general definition of the classic daily moving averages on the daily chart D1.
Bollinger Bands
A break in the upper limit of the indicator at 1.2411 will lead to a sharp increase in the pound. A break in the lower border of the indicator around 1.2350 will increase the pressure on the pair.
Description of indicators
- Moving average (moving average determines the current trend by smoothing out volatility and noise). Period 50. The graph is marked in yellow.
- Moving average (moving average determines the current trend by smoothing out volatility and noise). Period 30. The graph is marked in green.
- MACD indicator (Moving Average Convergence / Divergence - moving average convergence / divergence) Fast EMA period 12. Slow EMA period 26. SMA period 9
- Bollinger Bands (Bollinger Bands). Period 20


