


Trend analysis:
This week, the price from the level of 1.2401 (closing of the last weekly candlestick) will move down with the target at 1.2284 - support line (red bold line), and if this line is tested, working up with the first upper target at 1.2462 - a pullback level 50% (red dashed line) will be considered. If this level is broken up, we will continue to the next target at 1.2710 - a pullback evel of 61.8% (red dashed line). A pullback from this level.
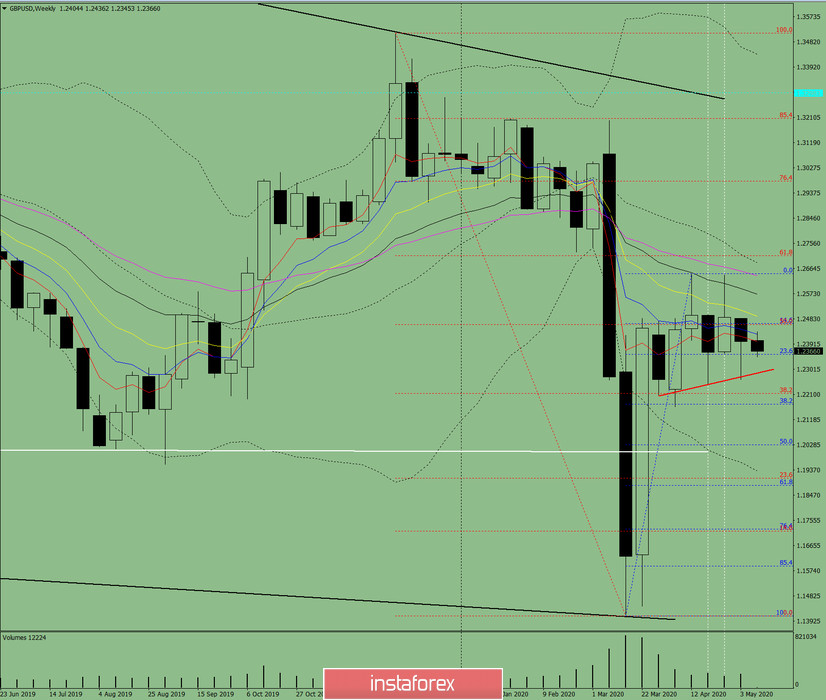
Fig. 1 (weekly schedule).
Comprehensive analysis:
- indicator analysis - up;
- Fibonacci levels - up;
- volumes - up;
- candlestick analysis - neutral;
- trend analysis - down;
- Bollinger Lines - down;
- monthly chart - up.
The conclusion of a comprehensive analysis is an upward movement.
The overall result of calculating the candle of the GBP/USD currency pair on a weekly chart: the price on the week is likely to have an upward trend with the presence of the first lower shadow of the weekly white candle (Monday – up) and the absence of the second upper shadow (Friday - up).
The first lower target of 1.2284 is the support line (red bold line). Followed by working up with the target of 1.2462 - a pullback level of 50% (red dashed line). The weekly upper target of 1.2710 - a pullback level of 61.8% (red dashed line).
An unlikely scenario: the price working down with the first lower target of 1.2174 - a pullback level of 38.2% (blue dashed line) from the support line is 1.2284 (red bold line). When this level is broken down, continue working down with the target of 1.2028 - a pullback level of 50% (blue dashed line).


