


Trend analysis (Fig. 1).
Today, an upward pullback is possible from the support line 1.2288 (presented in a red bold line) with the first target at 1.2400 - a 38.2% retracement level (presented in a red dashed line). If this level is reached, the upward movement will continue with the next target at 1.2447 - a 50.0% pullback level (presented in a red dashed line).
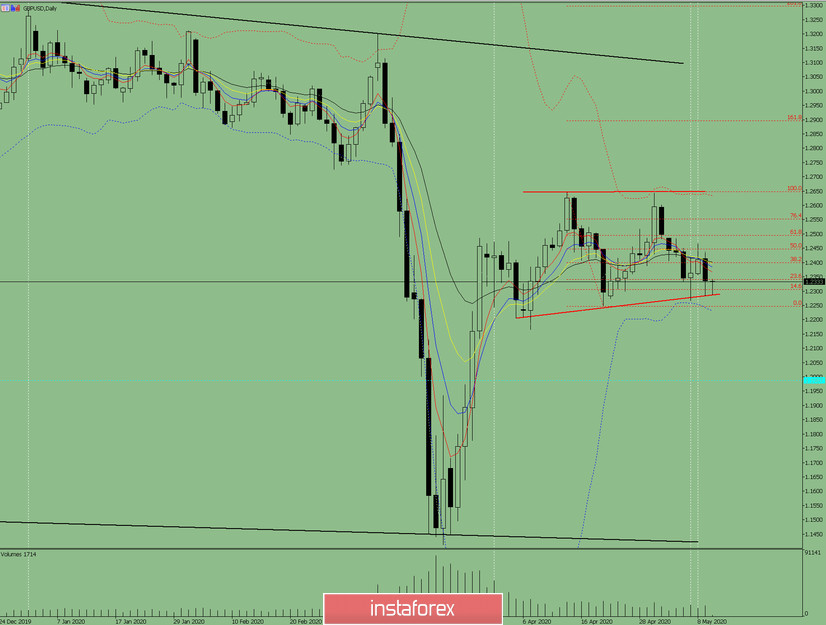
Fig. 1 (daily chart).
Comprehensive analysis:
- Indicator analysis - up;
- Fibonacci levels - up;
- Volumes - up;
- Candlestick analysis - up;
- Trend analysis - up;
- Bollinger Lines - down;
- Weekly schedule - up.
General conclusion:
Today, the price may move upward with a target at 1.2447 - a 50.0% pullback level (presented ina red dotted line).
Another possible scenario is a downward trend from 1.2337 - a 23.6% pullback level (presented in a red dashed line) with a target at the lower fractal 1.2247 (presented in a red dashed line).


