


Hello!
In this article, we will conduct a technical analysis of the USD / CHF currency pair and try to find the actual points for entering the market. To begin with, let me remind you that today at 12:30 UTC the US consumer price index will be published, which largely gives the concept of inflationary pressure in the United States of America.
Weekly:
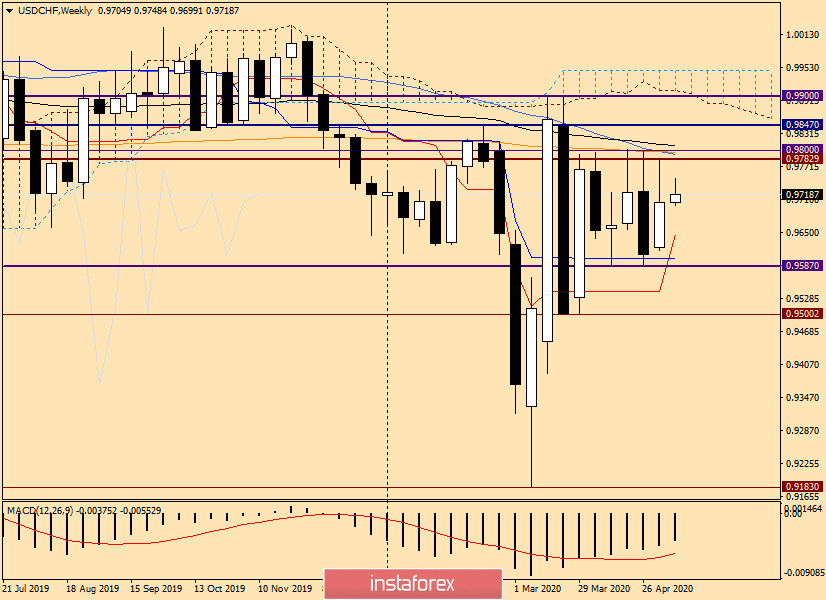
The USD / CHF currency pair completed the last five-day trading session with growth, however, the rather long upper shadow of the last candlestick casts doubt on the ability of this pair to continue strengthening.
Everyone knows that in the context of the COVID-19 pandemic, the US dollar is more often in demand among investors than other major currencies. In my opinion, this is a bit surprising, since the Japanese yen and the Swiss franc are considered as traditional shelter currencies. In addition, the situation with the spread of coronavirus in the United States and mortality from a pandemic, to put it mildly, leaves much to be desired.
So, the closing price of trading on May 4-8 was at the level of 0.9705, which is slightly higher than what is important and extremely significant for market participants at 0.9700. At the top of this, there are quite a lot of strong resistance areas that the bulls in this currency pair will have to overcome.
Above the highs of the previous trading, 0.9782 is another extremely important and strong level of 0.9800. This mark has repeatedly thrown the price down, and given that 50 MA, 200 EMA, and 89 EMA are grouped around it, a breakthrough of this level seems even more problematic. In the case of its implementation, the quotes may rise to the area of 0.9900. If you will look back into the previous trading, this mark is also extremely important and very strong.
If the market chooses a downward scenario, then the pair will go down to the Tenkan line of the Ichimoku indicator, which goes to 0.9645. A little lower, at 0.9602, is the even stronger Kijun line. Below it is a horizontal support level of 0.9587, a breakdown of which will send the pair to a psychological mark of 0.9500. These are the benchmarks on the weekly timeframe.
Daily:
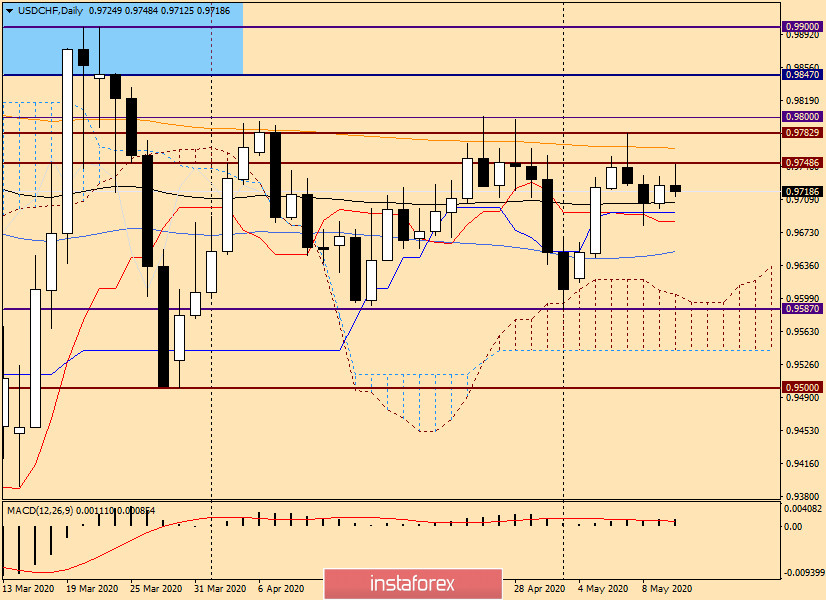
As can be seen clearly in this graph, the bulls on the instrument can not go up the orange 200 exponential moving average, which is now located at 0.9766. In my opinion, only a true breakdown of 200 exponents will give the USD / CHF bulls the opportunity to raise their course to higher values.
Below, support is provided by 89 EMAs, as well as Kijun and Tenkan lines. Near 0.9650, there is 50 simple moving average, which is also able to limit the possible downward movement and deploy the quotes in the opposite direction.
H4:
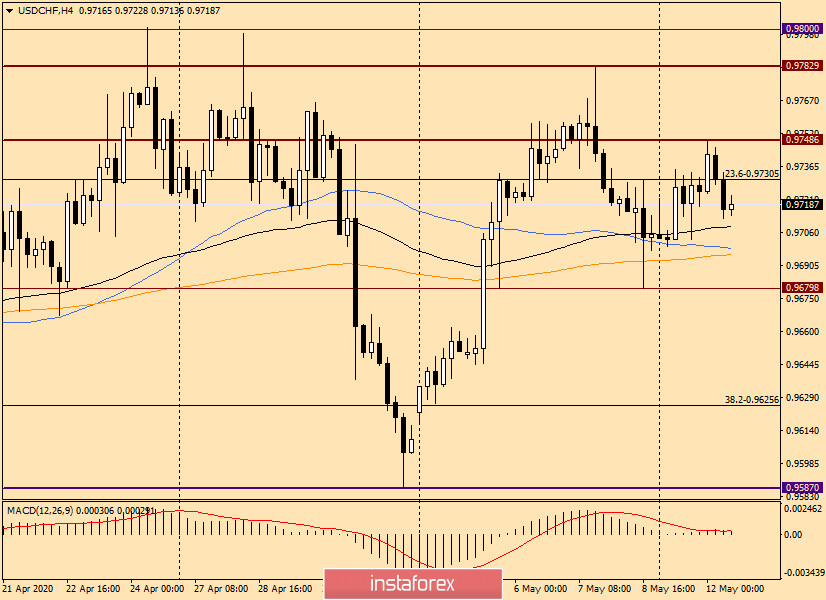
Here the nearest support is at 0.9680, however, the moving averages (89 EMA, 50 MA and 200 EMA) are located higher, which can also contain a possible decline. Resistance of sellers is at 0.9748 and 0.9783.
For trading ideas, I can offer sales from all the indicated resistances, and purchases from the supports listed in this review. The market is now very unpredictable, and no one knows for sure what will happen next and where the price will move. Based on this and in order to avoid unnecessary risks, I recommend opening positions in each of the parties only after the appearance of clear candle signals on the daily, 4-hour, and (or) hour timeframes. If anyone is interested in my personal opinion, I am more inclined to a bearish scenario, which means sales.
Good luck!


