


To open long positions on GBPUSD, you need:
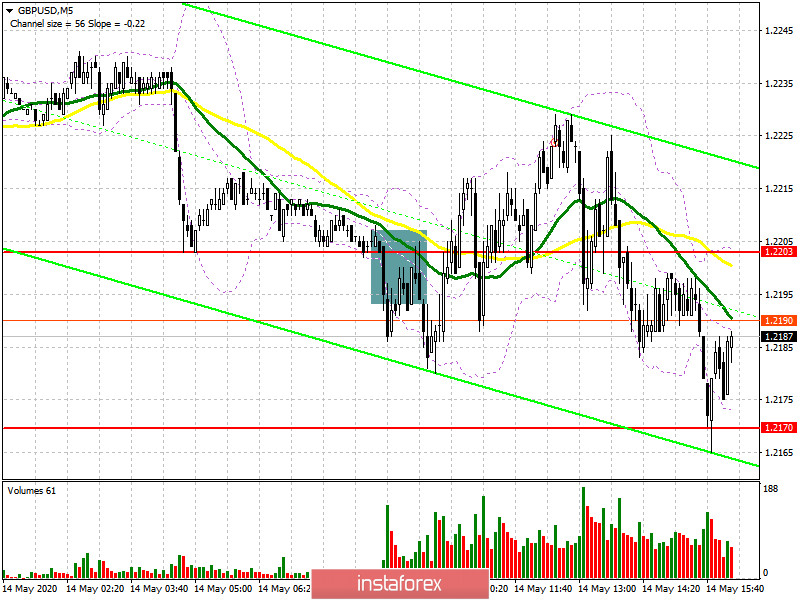
In my morning forecast, I paid attention to sales at the breakdown and consolidation below the level of 1.2203. If you look closely at the 5-minute chart, you can see how the bears managed to break below this range and even tested it from the bottom up, which formed a good sell signal further down the trend. Unfortunately, the downward movement did not amount to more than 30 points, which led to a market reversal and the removal of a short position to zero. However, if someone carefully read the morning review, I placed special emphasis on the support level of 1.2170 and recommended opening long positions from it. At the moment, this signal continues to work itself out and buyers can count on a return to the area of intermediate resistance of 1.2225, fixing above which will necessarily lead GBP/USD to a new wave of growth in the area of the highs of 1.2275 and 1.2323, where I recommend fixing the profits. If the market starts to gradually return to the support of 1.2170 by the middle of the North American session, then it is better to exit long positions and wait for the update of the larger lows of 1.2127 and 1.2030, from where you can buy immediately for a rebound in the expectation of correction of 30-40 points within the day. And it is important to remember that buying the pound even at current lows, you are going against the trend.
To open short positions on GBPUSD, you need:
Bears did not act very actively and showed themselves only after the speech of the Governor of the Bank of England. Although the sellers managed to cope with the morning breakout of 1.2203, however, they failed to do anything with the larger support of 1.2170, which is now their main goal. Only a break in this range will return major players to the market that can collapse the pound to the area of lows of 1.2127 and 1.2030, where I recommend fixing the profits. A more optimal and safe scenario for opening short positions will be an upward correction of GBP/USD in the second half of the day to the resistance area of 1.2225, where I recommend opening short positions if a false breakout is formed. Selling the pound immediately on the rebound can only be after testing the highs of 1.2275 and 1.2323 in the expectation of a downward movement to the close of the day.
Signals of indicators:
Moving averages
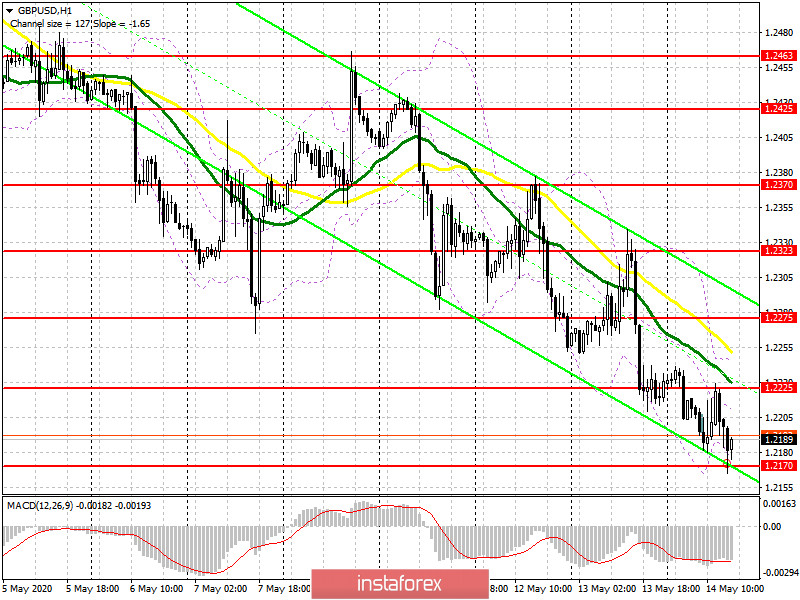
Trading is below the 30 and 50 daily averages, which indicates a continuation of the bearish trend.
Note: The period and prices of moving averages are considered by the author on the hourly chart H1 and differ from the general definition of the classic daily moving averages on the daily chart D1.
Bollinger Bands
A break in the lower border of the indicator at 1.2170 will increase the pressure on the pair, while a rise in the upper border at 1.2230 will strengthen the British pound.
Description of indicators
- Moving average (moving average determines the current trend by smoothing out volatility and noise). Period 50. The graph is marked in yellow.
- Moving average (moving average determines the current trend by smoothing out volatility and noise). Period 30. The graph is marked in green.
- MACD indicator (Moving Average Convergence / Divergence - moving average convergence / divergence) Fast EMA period 12. Slow EMA period 26. SMA period 9
- Bollinger Bands (Bollinger Bands). Period 20


