


The GBP / USD pair traded on a side channel on Thursday, where after testing the pullback level of 38.2% - 1.2174 (blue dotted line), quotes went up and closed near the opening point. The downward movement is likely to continue today. Important news that may affect dollar rates are expected to come out today at 13:30 and 15:00 (UTC+1)
Trend analysis (Fig. 1).
On Friday, the market will try to move downwards from the level of 1.2230 (closing of yesterday's candle), targeting the pullback level 38.2% - 1.2174 (blue dotted line). If the level is reached, resume the work downwards, targeting the level of 1.2029 - pullback level of 50.0% (blue dashed line).
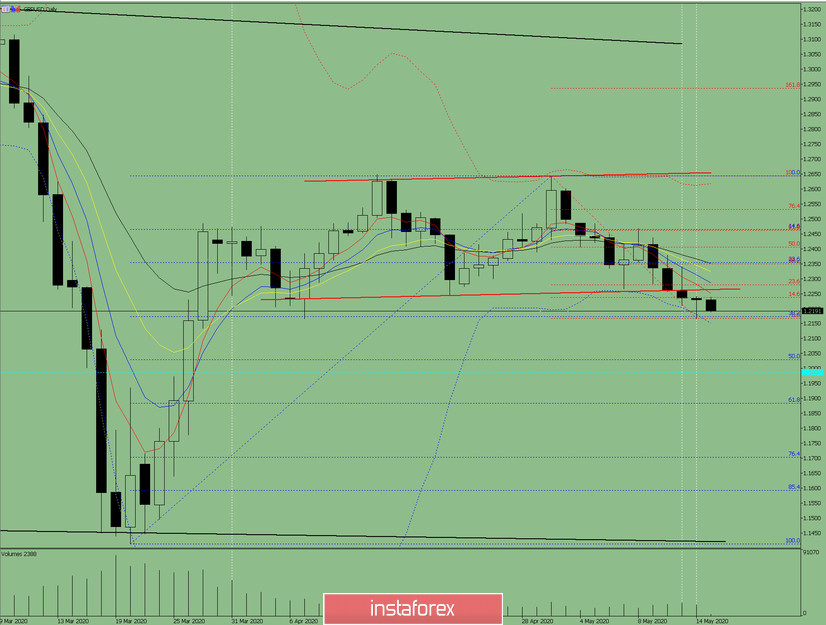
Fig. 1 (daily chart).
Complex analysis:
- Indicator analysis - down;
- Fibonacci levels - down;
- Volumes - down;
- Candlestick analysis - up;
- Trend analysis - down;
- Bollinger lines - down;
- Weekly schedule - down.
General conclusion:
Today, quotes will try to move down, targeting the level of 1.2029 - pullback level of 50.0% (blue dotted line).
Unlikely scenario: An upward movement from the pullback level of 38.2% - 1.2174 (blue dashed line), targeting the level of 1.2349 - pullback level of 38.2% (red dashed line).


