


Trend analysis (Fig. 1).
Today, an upward movement is possible from the level of 1.2108 (closing of the Friday afternoon candle) with the target of 1.2160 - a 14.6% retracement level (presented in a red dashed line). If this line is reached, the upward movement is likely to continue with the next target at the resistance line 1.2265 (presented in a red bold line).
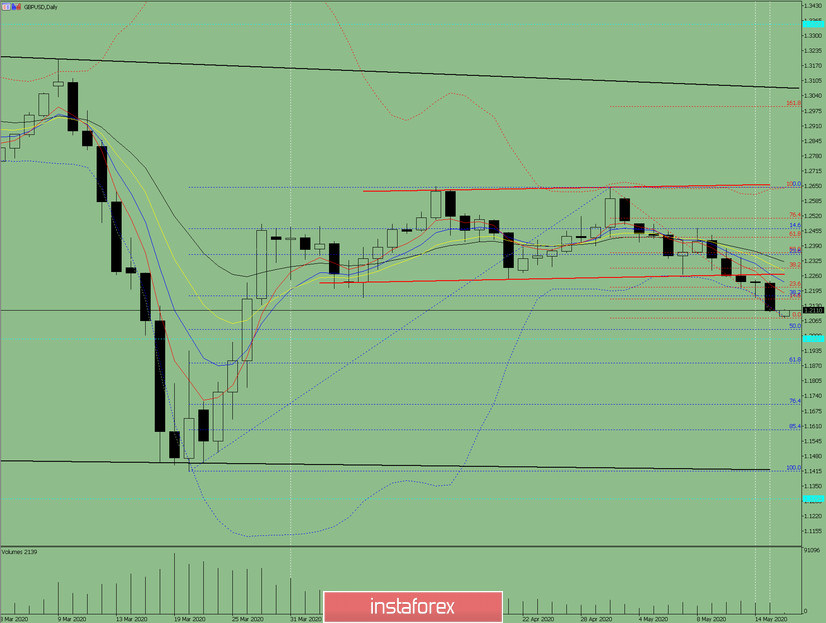
Fig. 1 (daily chart).
Comprehensive analysis:
- Indicator analysis - up;
- Fibonacci levels - up;
- Volumes - up;
- Candlestick analysis - up;
- Trend analysis - up;
- Bollinger Lines - up;
- Weekly schedule - up.
General conclusion:
Today, the price may move upward with the target at the resistance line 1.2265 (presented in a red bold line).
Another possible scenario is a downward trend from 1.2160 - a 14.6% retracement level (presented in a red dashed line) with the target of 1.1884 - a 61.8% retracement level (presented in a blue dashed line).


