


The pair traded upward on Thursday after testing 1.2186 - a 50.0% pullback level (presented in a red dashed line) then closed the daylight candle 37 points higher. Today, the price may either try to break down the pullback level of 50% or will move upwards from the level of 1.2186. Nothing is expected for the economic calendar news.
Trend analysis (Fig. 1).
Today, a downward trend is possible from the level of 1.2230 (closing of yesterday's candle) with the target of 1.2186 - a 50.0% pullback level (presented in a red dashed line). If this level is reached, an upward pullback is possible with the target at the upper fractal 1.2296 (presented in a red dashed line).
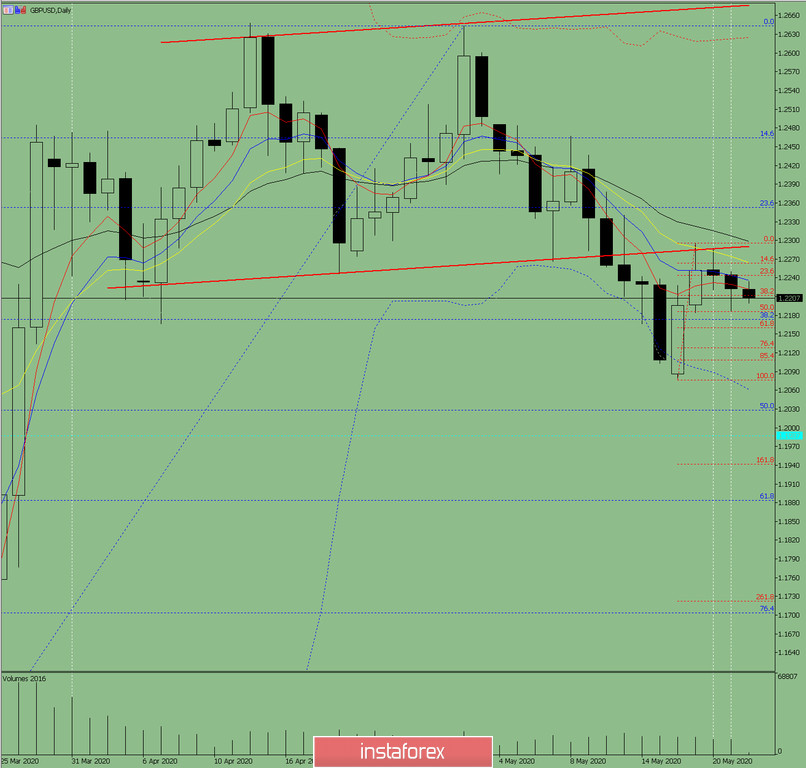
Fig. 1 (daily chart).
Comprehensive analysis:
- Indicator analysis - down;
- Fibonacci levels - down;
- Volumes - down;
- Candlestick analysis - up;
- Trend analysis - down;
- Bollinger Lines - down;
- Weekly schedule - up.
General conclusion:
Today, the price may move downwards with the target of 1.2186 - a 50.0% pullback level (presented in a red dashed line). If this level is reached, an upward pullback is possible with the target at the upper fractal 1.2296 (presented in a red dashed line).
Another possible scenario is an upward trend from 1.2160 - a 61.8% retracement level (presented in a red dashed line).


