


On Monday, the pound/dollar pair was moving downwards. The pair failed to break the 61.8% Fibonacci retracement level set at 1.2161 (a red dotted curved line). After that, the price started rising. Today, the price is likely to go on climbing. Today, market participants are waiting for important macroeconomic events.
Trend analysis (picture 1)
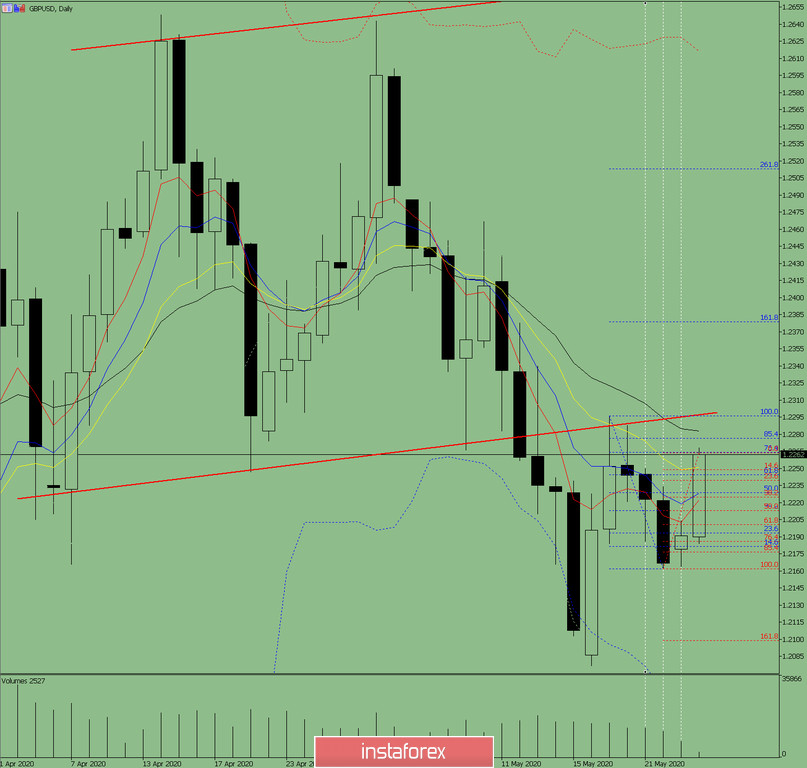
On Tuesday, the market may continue moving up from the level of 1.2191 (yesterday's close of the daily candle). The main target is the 21 EMA set at 1.2282 (a black thin line). If the price reaches the line, traders may open sell deals.
Trend analysis (picture 1)
On Tuesday, the market may continue moving up from the level of 1.2191 (yesterday's close of the daily candle). The main target is the 21 EMA set at 1.2282 (a black thin line). If the price reaches the line, traders may open sell deals.
Picture 1 (A daily chart)
Comprehensive analysis:
- indicator analysis - up;
- Fibonacci levels - up;
- volumes - up;
- candle analysis - up;
- trend analysis - up;
- Bollinger bands - down;
- weekly chart - up.
Conclusion:
Today, the price could make an attempt to hit the 21 EMA set at 1.2282 (a black thin line).
According to the unlikely scenario, it will be possible to open sell deals from the 76.4% retracement level of 1.2264 (blue dotted line), with the target at 1.2225 - the retracement level of 38.2% (red dotted line).


