Crypto Industry News:
The Bank for International Settlements (BIS), a financial institution owned by central banks from around the world, has published a report analyzing the development of the decentralized finance industry (DeFi). The article begins with the words: "There is an 'illusion of decentralization' in DeFi because the need for management makes some level of centralization inevitable and the structural aspects of the system lead to a concentration of power.
"If DeFi were to spread, their weaknesses could threaten financial stability. They could be severe due to high levels of leverage, liquidity mismatches, built-in interconnections, and the absence of shock absorbers like banks," we read.
According to BIS, all DeFi protocols have inherent centralization elements due to their centralized management framework, similar to that of legal entities such as corporations. In addition, some DeFi Blockchains concentrate power in the hands of the largest coin holders or people with access to inside information as part of the sale of tokens.
Technical Market Outlook
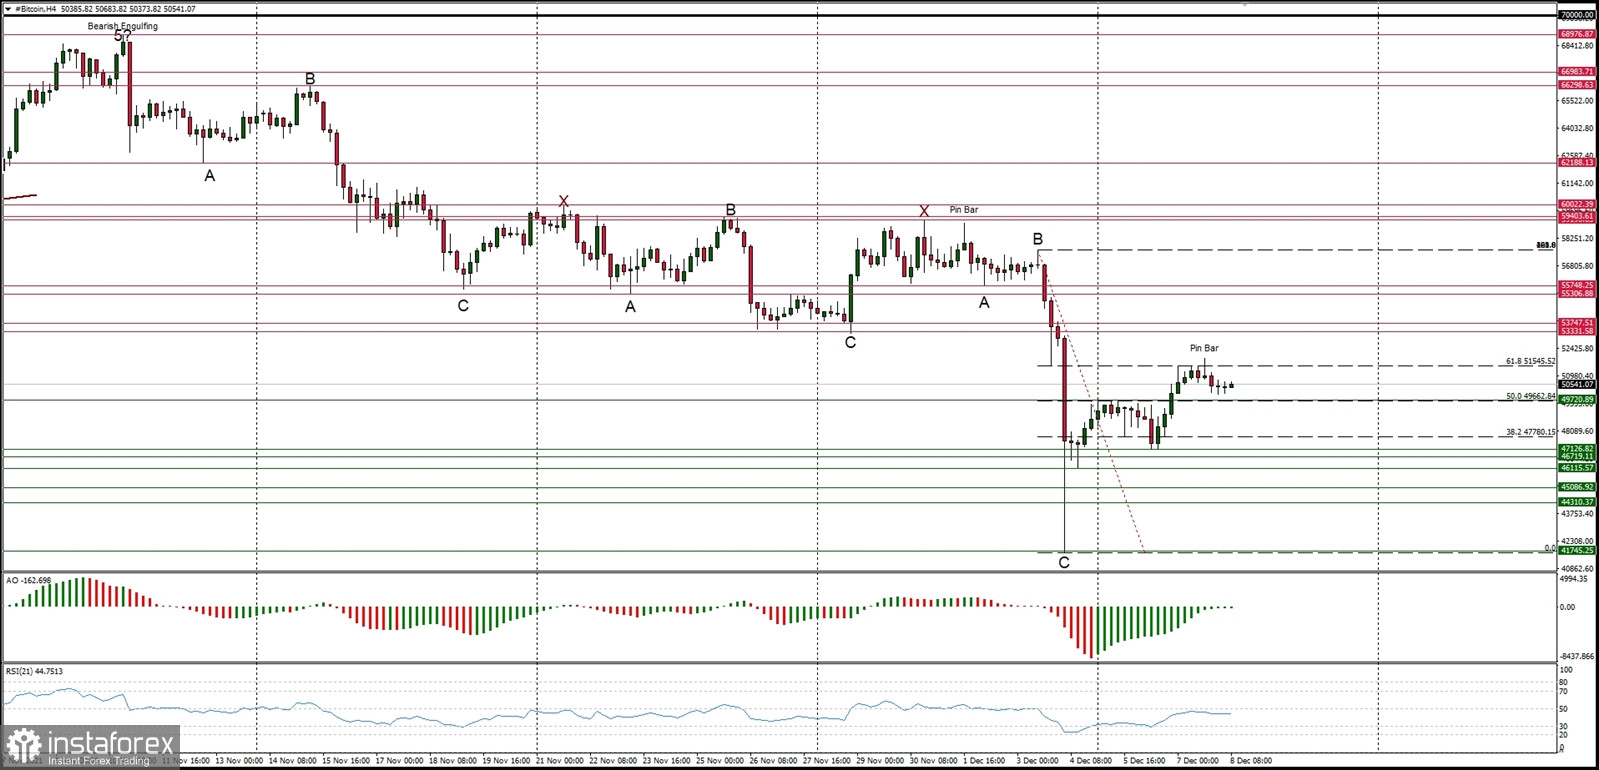
The BTC/USD pair has hit the level of $51,545 which is the 61% Fibonacci retracement of the last wave down and is currently consolidating the recent gains in a narrow range. The next technical resistance is located at $53,333. The immediate technical support is seen at $49,720. The momentum is picking up from the oversold conditions, currently hovering around the level of fifty on the RSI (14) indicator. Despite the recent complex and time consuming corrective decline in form of ABCxABCxABC pattern, the larger time frame trend remains up.
Weekly Pivot Points:
WR3 - $75,308
WR2 - $67,229
WR1 - $57,614
Weekly Pivot - $49,717
WS1 - $40,054
WS2 - $31,972
WS3 - $22,000
Trading Outlook:
The ABCxABCxABC complex corrective cycle might be terminated at the level of $41,678 and the market is ready to continue the up trend. According to the long-term charts the bulls are still in control of the Bitcoin market and the next long term target for Bitcoin is seen at the level of $70,000. This scenario is valid as long as the level of $39,474 is clearly broken on the daily time frame chart (daily candle close below $39,000 would be considered as a long-term trend change due to the lower low placement).


