


The pair traded upwards on Wednesday and tested 1.2360 - a 50% pullback level (presented in a blue dashed line). After that, a downward pullback took place and tested 1.2224 - a 50% pullback level (presented in a red dashed line). Today, the price is likely to begin to move up. Economic calendar news for the dollar is expected at 12:30, 14:00, and 15:00 UTC.
Trend analysis (Fig. 1).
Today, an upward trend is possible from the level of 1.2261 (closing of yesterday's candle) retargeting 1.2360 - a 50.0% pullback level (presented in a blue dotted line). In case of breaking through this level, the upward movement may continue with the next target of 1.2427 - a 61.8% retracement level (presented in a blue dashed line).
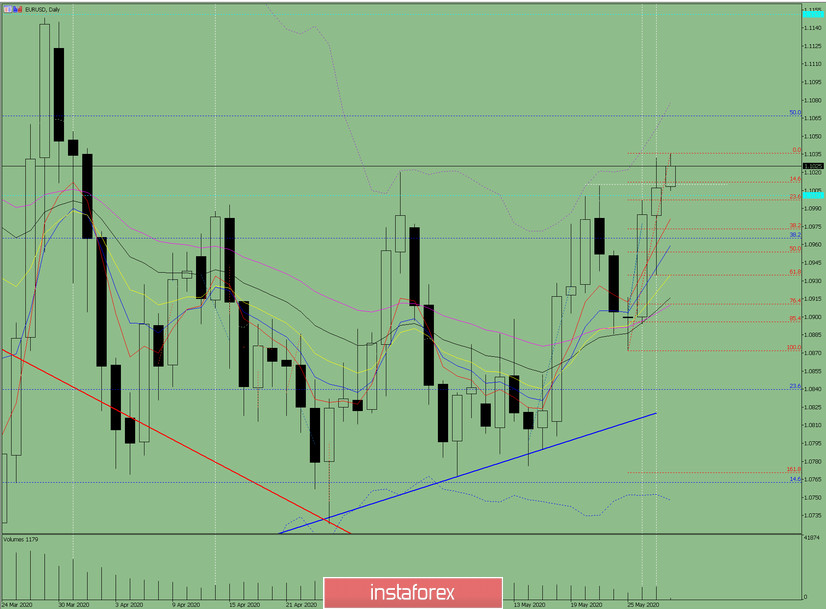
Fig. 1 (daily chart).
Comprehensive analysis:
- Indicator analysis - up;
- Fibonacci levels - up;
- Volumes - up;
- Candlestick analysis - up;
- Trend analysis - up;
- Bollinger Lines - down;
- Weekly schedule - up.
General conclusion:
Today, the price may move upwards retargeting 1.2360 - a 50.0% pullback level (presented in a blue dotted line).
Another possible scenario is a downward trend from 1.2360 - a 50.0% pullback level (presented in a blue dashed line) with the target of 1.2323 - a 14.6% pullback level (presented in a red dashed line).


