To open long positions on EURUSD, you need:
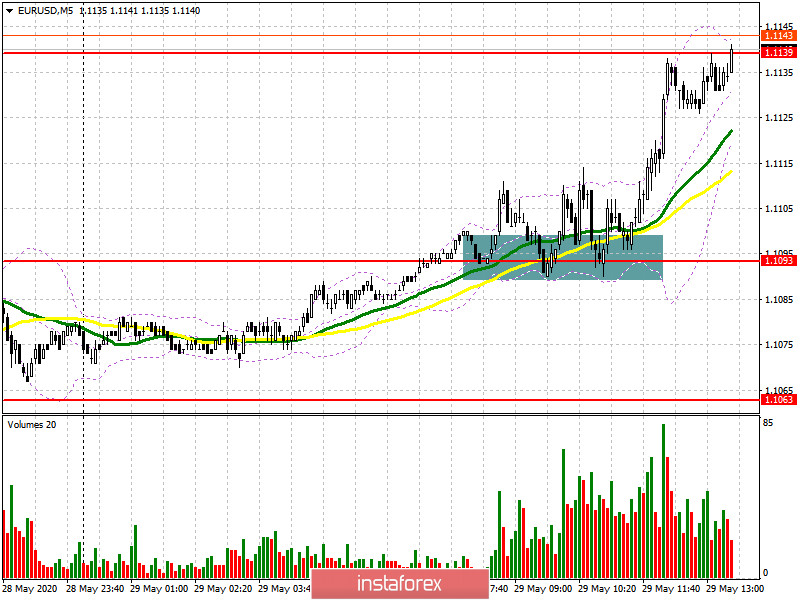
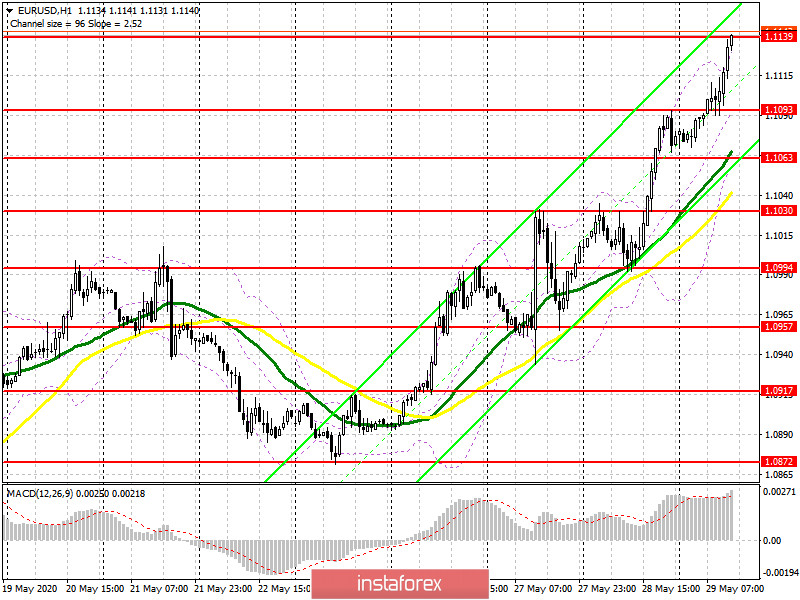
The report on retail sales in Germany was much better than economists' forecasts. Although sales declined, demand for the euro resumed amid the belief that the Eurozone economy will be able to better survive the crisis, which is expected. A good buy signal was formed in the first half of the day at the level of 1.093. I paid attention to it in the morning forecast. If you look at the 5-minute chart, you will see a breakout and consolidation above the level of 1.093. The bears tried to break below this range tow times, however, they failed, which led to the continuation of the upward trend and the maximum test of 1.1139. At the moment, trading is conducted around this level and further movement will depend on the data on the US economy, as well as on whether the bulls will be able to gain a foothold above this range. Only by analogy with the morning situation around 1.093, I recommend continuing to open long positions above the resistance of 1.139 with the main goal of updating the maximum of 1.1231, where you can fix profits. If there is no active growth of EUR/USD above 1.139 in the second half of the day, it is best to postpone purchases and wait for the correction of the euro to the support area of 1.1093 or open long positions immediately to rebound from the larger lows of 1.1063 and 1.1030. And the lower the better, since it is not known what Donald Trump will say during his press conference on the situation in China.

To open short positions on EURUSD, you need:
Sellers tried to stop the bull market, however, it did not lead to anything good. A slight pause after the resistance test of 1.1139 was quite expected, as I mentioned in the morning forecast. Now the bears need to wait for the release of fundamental statistics on income and spending of Americans, as well as the speech of the US President. The formation of a false breakout in the resistance area of 1.1139 will be the first signal to open short positions, which will be the support of 1.1093. Only fixing below this level will lead to a more serious sale of EUR/USD in the area of the lows of 1.1063 and 1.1030, where I recommend fixing the profits. In a scenario of further growth of the euro in the second half of the day, the short position is better to get back on the rebound from the high of 1.1231 not a correction of 20-30 points by the end of the week.

Signals of indicators:
Moving averages
Trading is conducted above the 30 and 50 daily moving averages, which indicates the continuation of the bull market.
Note: The Period and prices of moving averages are considered by the author on the hourly chart H1 and differ from the general definition of the classic daily moving averages on the daily chart D1.
Bollinger Bands
If the euro falls, the lower border of the indicator around 1.1063 will provide support.
Description of indicators
- Moving average (moving average determines the current trend by smoothing out volatility and noise). Period 50. The graph is marked in yellow.
- Moving average (moving average determines the current trend by smoothing out volatility and noise). Period 30. The graph is marked in green.
- MACD indicator (Moving Average Convergence / Divergence - moving average convergence / divergence) Fast EMA period 12. Slow EMA period 26. SMA period 9
- Bollinger Bands (Bollinger Bands). Period 20


