From the point of view of complex analysis, we can see that the quotes reached the control area of interaction of trade forces.
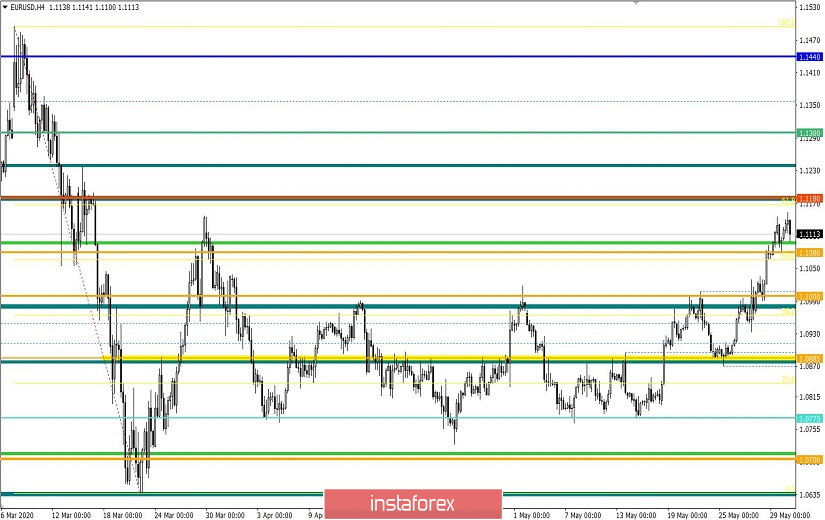
The past trading week had in itself not just an upward spiral of long positions, but also the first radical change in market tacts in a long time. The flat 1.0775 // 1.0885 // 1.1000, which traders focused on for two months, lost its major role and was replaced by an upward impulse, which confirmed the bullish mood of traders and consolidated the quotes above the value of 1.1080. However, movement did not stop there, and the quotes managed to reach March 27's high, 1.1147, as well as the area of interaction of trade forces, 1.1150 / 1.1200. Such occurrences further fueled the interest in the current movement.
Traders, inspired by the dramatic changes, began to discuss the further course of the pair, having forgotten that the trend is still downward, and attempts to change it have been recorded repeatedly in the market. One sound idea is that the market is again active, so local positions may be considered as main trading operations.
Analyzing Friday's trading in detail, we can see that the upward trend started at the Asian session, from which the quotes managed to pass the level of 1.1145, and reached March 27's high, 1.1147. The following movement was a local rebound, on which the trading week ended.
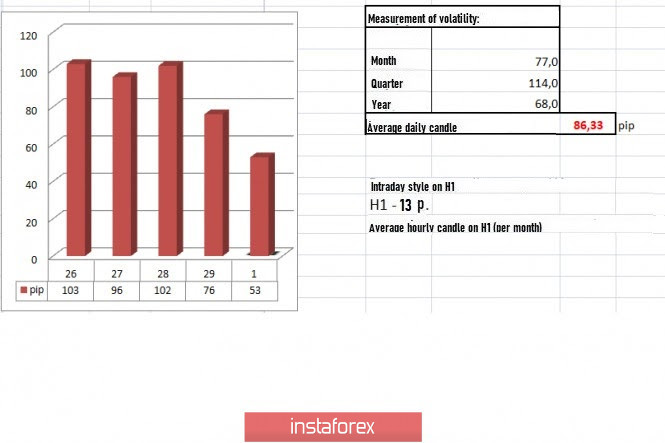
In terms of volatility, a slight slowdown was observed, relative to Friday. However, if we take into account the entire past week, the average daily indicator is 84 points, which is already considered the norm of an active market.
As discussed in the previous review, traders held long positions for more than one day, from which the area 1.1150 / 1.1190 was supposed to become a platform for opening transactions.
Looking at the daily chart, we can see the third attempt of traders in changing the medium term downward trend. The trend in long-term trading is also downward.
Meanwhile, the news published on Friday contained preliminary data on inflation in Europe, which came out worse than expected, having a decrease from 0.3% to 0.1%.
The indicator, in anticipation of the ECB meeting on June 4, escalates the fear of investors, as inflation rate has always been considered in the regulator's actions in monetary policy.
In the US, another street war occurred, which was replaced up by the death of African-American George Floyd. More than 25 major cities in the country, as well as several states, including the District of Columbia, were surrounded by protests, riots and looting, which in all saw not only the abuse of law enforcement and interracial hatred by individuals, but also the tiredness and hopelessness of citizens who perhaps lost the only source of income amid quarantine measures.
The riots will soon come to naught, but local pressure was already exerted on the US dollar.
With regards to the coronavirus, which severely undermined the economy of the United States, Fed Chairman Jerome Powell, during a video conference, expressed his concerns on the risks of a second wave.
"I worry that a second wave will undermine confidence and lead to a slower and weaker recovery, as a full economic recovery depends on people's confidence that it's safe to go out and take part in a wide range of economic activities," Powell said.
Today, the Manufacturing PMI in the Eurozone was published, in which the data concided with the economists forecast, and recorded an increase from 33.4 to 39.4. The forecast was 39.5.
A similar PMI is to be published in the United States, where an increase from 41.5 to 43.0 in the index is expected.

Further development
Analyzing the current trading chart, we can see that the quotes managed to pass March 27's high, 1.1147, but fell again from the area of interaction of trading forces, which lies between 1.1147 and 1.1180 / 1.1200. The movement led to the consolidation of long positions and initial rebound of quotes. Continued pressure may lead to a technical correction.
The bullish mood may temporarily be replaced by a slowdown, from which in case of growth and consolidation of prices lower than 1.1080, a technical correction will develop. Meanwhile, if the quotes consolidate above 1.1160, and then fix above 1.1200, the trend will change.
Given the above information, we present these trading recommendations:
- Open sell positions lower than 1.1080, towards 1.1000.
- Open buy positions higher than 1.1060, towards 1.1200. Subsequent transactions will depend on the consolidation of prices.

Indicator analysis
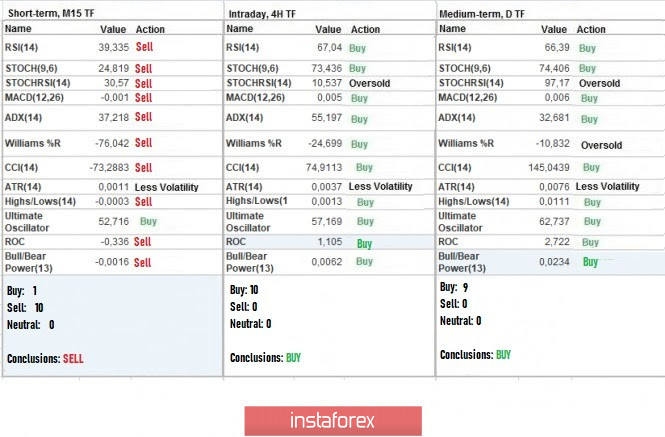
Analyzing the different sectors of time frames (TF), we can see that the indicators of hourly and daily periods signal a bullish mood, influenced by the trend change and focus of quotes on March 27's high.

Volatility per week / Measurement of volatility: Month; Quarter Year
The measurement of volatility reflects the average daily fluctuation calculated for the Month / Quarter / Year.
(June 1 was built, taking into account the time of publication of the article)
Volatility is currently 53 points, which is lower than the daily norm. With this, we can assume that if a slowdown does not occur, the speculative mood will do its job and accelerate the quotes.

Key levels
Resistance areas: 1,1000 ***; 1.1080 **; 1,1180; 1.1300; 1.1440; 1.1550; 1.1650 *; 1.1720 **; 1.1850 **; 1,2100
Support areas: 1.0850 **; 1.0775 *; 1.0650 (1.0636); 1,0500 ***; 1.0350 **; 1,0000 ***.
* Periodic level
** Range Level
*** Psychological level


