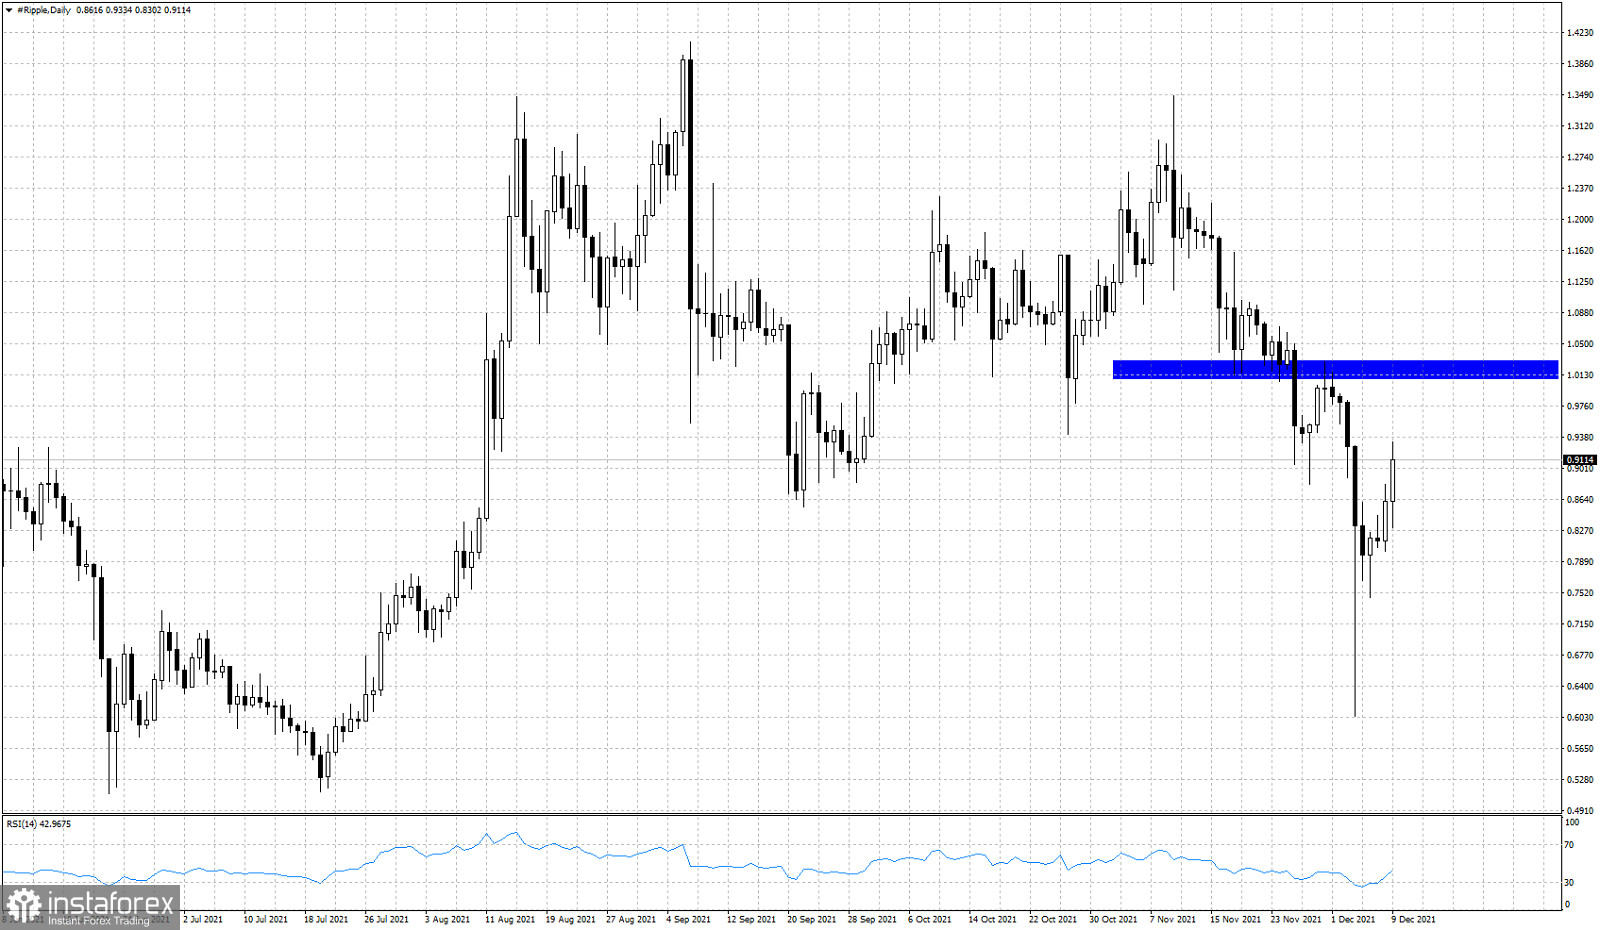
At the end of November we warned XRPUSD bulls that price was forming a bearish descending triangle pattern and that a break below $1 would be an added bearish signal that could push price towards $0.80 or even lower.

Almost two days later price broke below support and provided a bearish signal. Price back tested the blue resistance area that was once support but now remains resistance. The rejection that followed, pushed prices towards $0.60 surpassing our initial pull back targets. Price is now approaching $0,91 and although trend technically remains bearish, bulls have a lot of hopes of a major reversal in play. For this bullish scenario to hold, price must remain above $0.60 otherwise there is danger of pushing as low as $0.40-$0.20. Breaking above $1 would also be an important bullish signal.


