Long deals on EUR/USD:
The US dollar is under pressure amid the absence of important fundamental statistics. Moreover, there are still protests in most US cities despite curfews. Buyers of the euro are benefiting from the situation and breaking rather strong resistance levels.
The COT reports for the previous week showed a sharp rise in the number of long positions to 175,034 from 167,756. As a result, noncommercial net positions jumped to 75,222 from 72,562. It means that traders are becoming more interested in risk assets.
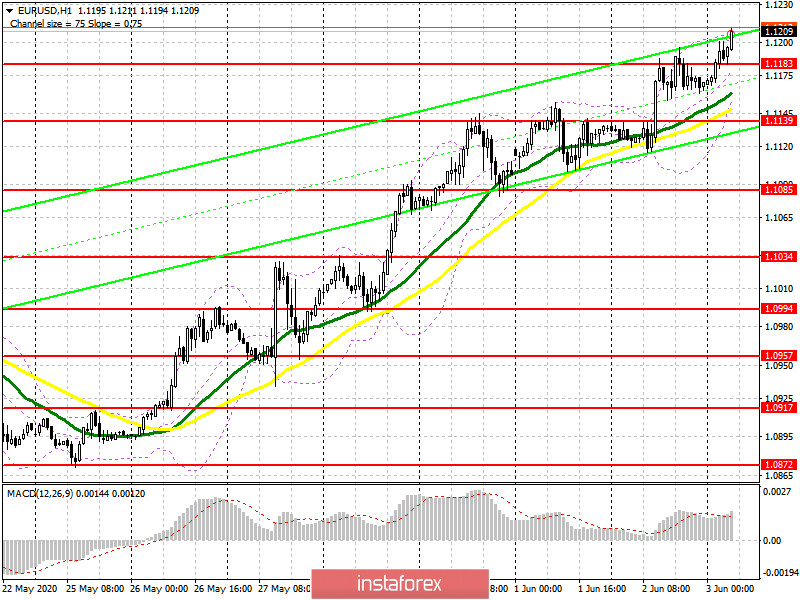
Let's take a look at the current intraday technical conditions. We should pay attention to the resistance level of 1.1231 as buyers of the euro are approaching it at the moment. If the price consolidates at this level, it may climb to such highs as 1.1295 and 1.1344 where traders are recommended to take profit.
A false break of the level of 1.1183 will be a good signal to open long deals. However, if the pair drops below the level, the euro will be under great pressure. Thus, it is better to open buy deals after the pair breaks the support level of 1.1139. There is a moving average slightly above the support level. It is also possible to buy the euro/dollar pair after a bounce from the low of 1.1085. The target is correction of 30-35 pips by the end of the day.
Short deals on EUR/USD:
Today, sellers do not have enough reasons to enter the market. The eurozone and the US will report on business activity in their services sectors. Analysts suppose that the indicators may rise. Thus, a new wave of buying risk assets is quite expectable.
That is why I recommend to take the wait-and-see approach. It is better to wait until the pair reaches the first resistance level of 1.1231. You will have a chance to initiate a sell deal, if there is a false break of the level.
Besides, traders may open short positions, after the pair reaches the highs of 1.1295 and 1.1344. However, the pair should rebound from the levels. Moreover, if the price consolidates below the support level of 1.1183, speculator may lose their stop-orders. This, in its turns, could cause the euro's downward correction to the support level of 1.1139. Thus, bears could make an attempt to enter the market again. The low of 1.1085 is another target for sellers. It is better to take profit at the mentioned level.
I recommend traders to take a look at other analyses:
- A more detailed video review on June 3rd.

Signals of the indicators:
Moving averages:
Trading should be performed above the 30 and 50 moving averages. It points to an ongoing rise in the euro in a short-term perspective.
Note that the author of the article analyses the period and prices of the moving averages on the one-hour chart.
Bollinger Bands
If the price breaks the lower limit of the indicator at 1.1160, the euro will be under pressure.
Definitions of the indicators:
- Moving average (a moving average that determines the current trend by smoothing out volatility and noise). Period is 50. It is marked in yellow on the chart.
- Moving average (a moving average that determines the current trend by smoothing out volatility and noise). Period is 30. It is marked in green on the chart.
- MACD indicator (Moving Average Convergence/Divergence is a convergence/divergence of moving averages). The fast EMA period is 12. The slow EMA period is 26. The SMA period is 9.
- Bollinger Bands. Period is 20.
- Non-commercial traders are speculators such as individual traders, hedge funds, and large institutions that use the futures market for speculative purposes and meet particular requirements.
- Long non-commercial position represents a total long open position of non-commercial traders.
- Short non-commercial position represents a total short open position of non-commercial traders.
- The total non-commercial net position is a difference between short and long positions of non-commercial traders.


