


Good day, dear traders!
Yesterday, June 2, the Reserve Bank of Australia (RBA) announced its verdict on the interest rate. As a result of the meeting, it was decided not to make changes to the monetary policy parameters and to keep the main interest rate at 0.25%.
The bank believes that the measures taken are sufficient to support the Australian economy from the consequences of COVID-19. Let me remind you that the Australian Central Bank is actively buying government bonds, the volume of purchases of which, according to recent data, is 50 billion US dollars. At the same time, the RBA said that if necessary, the volume of purchases of securities can be increased. It is also possible to take additional measures to achieve inflation goals, as well as to raise the level of employment.
At this time, the RBA is concerned about a decline in household spending and a sharp increase in the number of unemployed due to the introduction of quarantine measures and the closure of many small and medium-sized businesses. As stated in the bank, such a difficult economic situation has not been since 1930. Economists of the Australian Central Bank forecast a drop in GDP in the first quarter of this year by 0.4%, while the previous indicator, for the 4th quarter of last year, showed an increase of 0.5%.
Well, let's analyze the technical picture that develops for the AUD/USD currency pair, and start with the results of the recently completed month.
Monthly
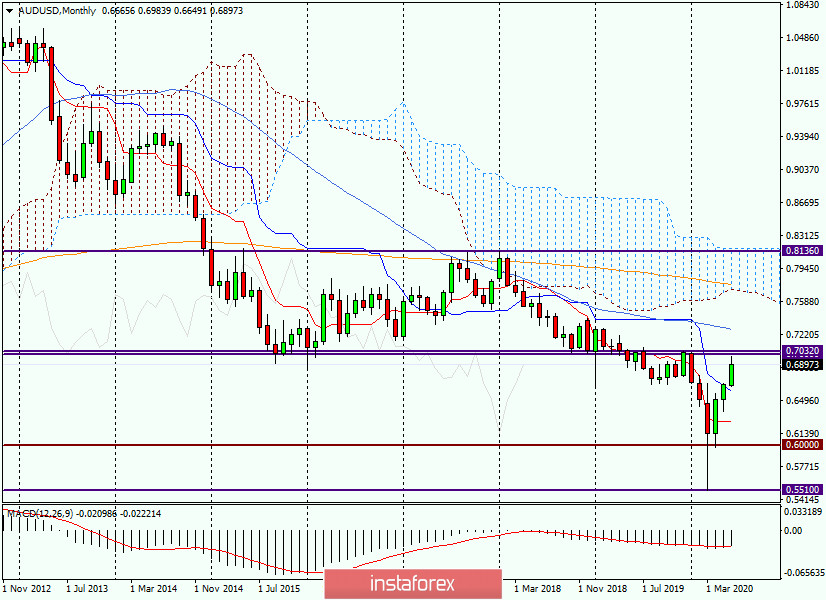
Analyzing the monthly timeframe, the March candle with an extremely long lower shadow and lows at 0.5510 immediately catches the eye. As a rule, such hefty tails make it clear that the market has reached the bottom and refuses to further decline. This is exactly what we saw in April, which resulted in the "bullish absorption" candle. The takeover can be considered not very convincing since the opening of April trading occurred in the same place where March closed. But they closed April significantly higher than the opening of the previous month's trading.
In May, the pair continued to rise, however, it was not as impressive as a month earlier. The pair had reached the Kijun line of the Ichimoku indicator and finished the last month of spring near it. The beginning of summer seemed to breathe new fresh energy into the bulls on "Aussie". The impressive growth in less than three trading days indicates a good future potential for players to increase the rate.
Now, the AUD/USD pair is trading near 0.6900, however, the real tests for the bulls on the "Aussie" will begin in the strong and important price zone of 0.7000-0.7032. First, there is a significant psychological and technical level of 0.7000. Secondly, this area shows the maximum values of December trading last year and January this year. Third, this is the proto-trading zone, which has repeatedly influenced the change in the price dynamics of this currency pair. In general, for those who are purchasing for the Australian dollar, I recommend fixing profits in the price zone of 0.7000-0.7032. I fully assume that a significant rebound or correction of the exchange rate will occur from here. If the second wave of COVID-19 begins and there is strong demand for the US dollar, the growth of the "Aussie" may end and the pair will once again turn in the direction of a global downward trend.
Daily
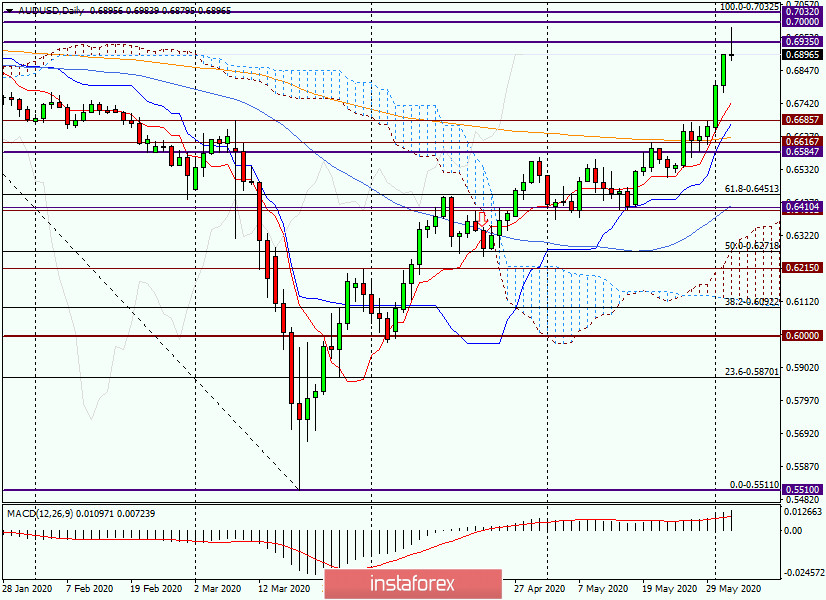
After a powerful upward two-day momentum, today's candle at the moment of completion of the review looks like a "tombstone" reversal model. If it maintains its current form until the end of trading, there will be a signal to open sales, which will still be of a corrective nature, because the prerequisites for continued growth remain on older timeframes.
In this scenario, I recommend considering opening short positions with targets near 0.6850 and (or) around 0.6800-0.6750. If bullish patterns of Japanese candlesticks appear in the area of these prices on the daily, four-hour, or hourly charts, the correction can be assumed to be complete and look at the purchases of the AUD/USD currency pair. Right here and now, it is better not to rush to open deals. It is already too late for sales, and for purchases, it is worth waiting for confirmation signals.
Good luck!


