


The pair traded upwards on Monday and re-tested the upper fractal 1.2648. Today, the price may begin to move downward. Economic calendar news for the dollar is expected at 14:00 UTC.
Trend analysis (Fig. 1).
Today, a downward pullback is possible from the level of 1.2724 (closing of yesterday's candle) with the first target of 1.2657 - a 14.6% retracement level (presented in a red dashed line). If this level is reached, the downward movement may continue with the next target of 1.2596 - a 23.6% retracement level (presented in a red dashed line).
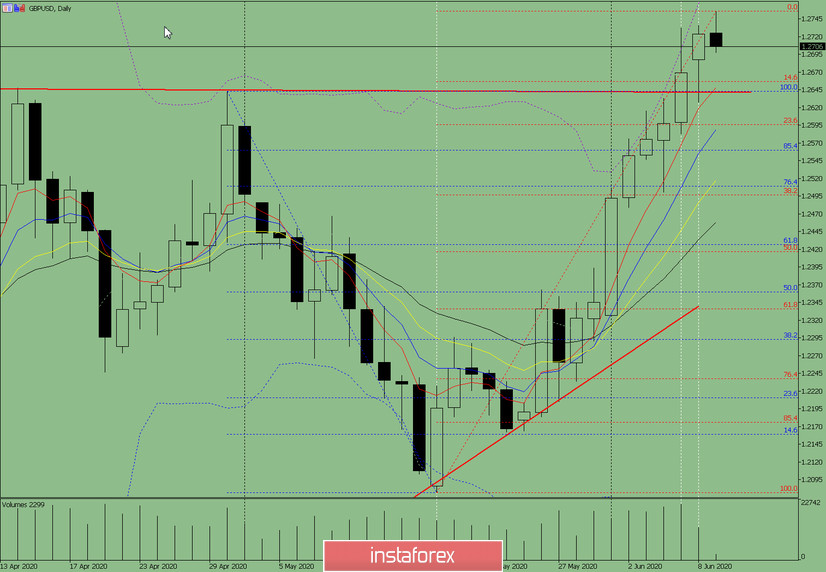
Fig. 1 (daily chart).
Comprehensive analysis:
- Indicator analysis - down;
- Fibonacci levels - down;
- Volumes - down;
- Candlestick analysis - down;
- Trend analysis - up;
- Bollinger Lines - down;
- Weekly schedule - down.
General conclusion:
Today, the price may begin to move downward with the target of 1.2657 - a 14.6% retracement level (presented in a red dotted line). If this level is reached, the downward movement may continue with the next target of 1.2596 - a 23.6% retracement level (presented in a red dashed line). Upon reaching this level, an upward pullback is possible.
Another possible scenario is an upward trend from 1.2657 - a 14.6% pullback level (presented in a red dashed line) with the target at the upper fractal 1.2756 (presented in a red dashed line).


