To open long positions on EUR/USD, you need:
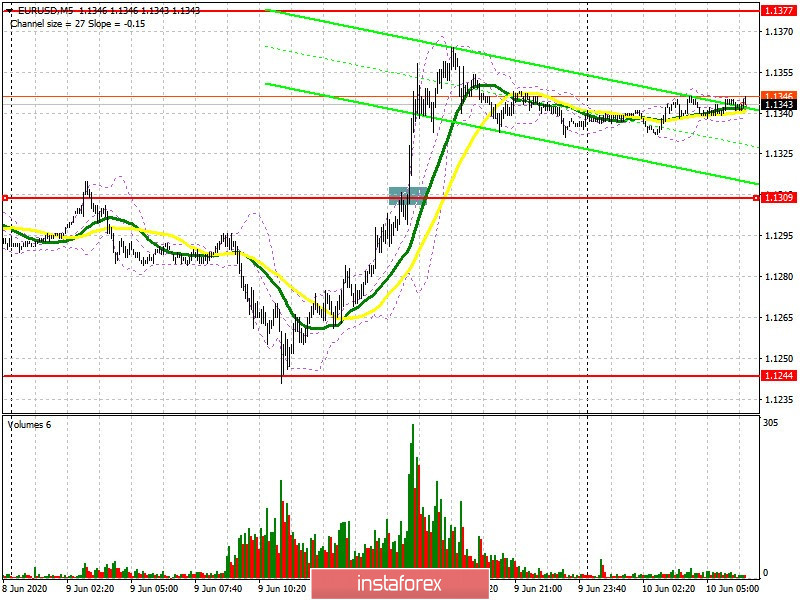
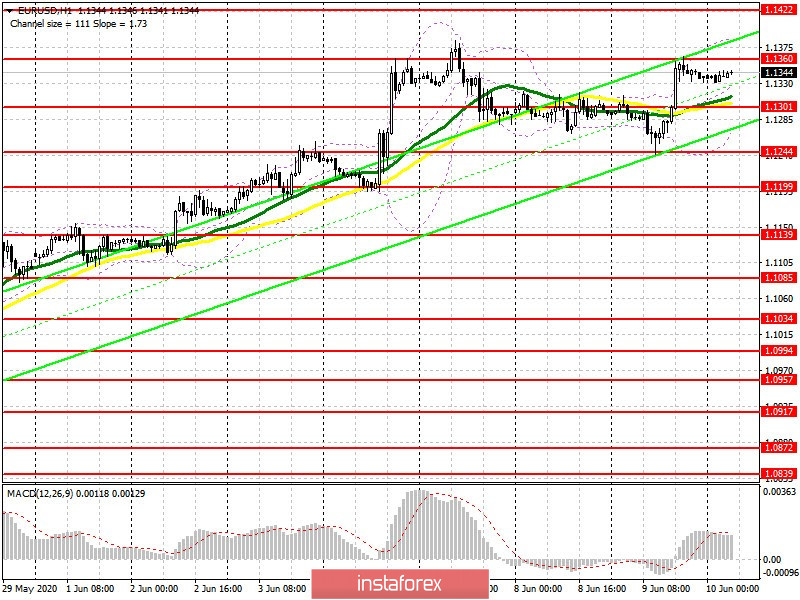
The bulls managed to cope with the pressure that persisted earlier this week due to weak fundamental indicators on the German economy, and they almost returned to last week's highs ahead of the Fed meeting while expecting continued growth after Fed Chairman Jerome Powell's speech. If you look at the 5-minute chart, you will see how the breakthrough of resistance 1.1309, to which I paid attention in my forecast for the afternoon, caused the upward trend in the euro to continue. At the moment, an important task of the bulls will be to protect this range, which has transformed in support of 1.1301. Moving averages are also taking place in the same area, which may also provide the necessary support for the euro in case it falls in the morning. However, I recommend opening long positions from this level only after forming a false breakout. Otherwise, it is best to buy EUR/USD immediately for a rebound from the weekly low in the area of 1.1244. However, a more important task of the bulls will be a breakthrough and consolidation above the resistance of 1.1360. This option will be another signal for new players regarding the upward trend in the euro, which will lead to updating new weekly highs in the areas of 1.1422 and 1.1459, where I recommend taking profits. You also need to remember that in the Commitment of Traders (COT) report for June 2, there was a reduction in both long and short positions, but sellers left the market more, which retains a bullish momentum in the pair. The report shows a reduction in short non-commercial positions from the level of 99,812 to the level of 93,172, while long non-commercial positions slightly decreased, from the level of 175,034 to the level of 174,412. As a result, the positive non-commercial net position increased again and amounted to 81,240, against 75,222, which indicates an increase in interest in buying risky assets even at current prices high enough for the market.

To open short positions on EUR/USD, you need:
As for short positions in euros, one should be extremely careful with them. Forming a false breakout in the resistance area of 1.1360 in the morning will be a signal to open short positions in the pair, however, many traders will concentrate on the US inflation report, which might significantly slow down, which could lead to another wave of EUR/USD growth. In this scenario, it is best to count on short positions after updating the highs of 1.1422 and 1.1459 while aiming for a downward correction of 30-40 points within the day. However, it is likely that traders will ignore the report before the Fed's decision on interest rates. Demand for the US dollar could return in the event of positive forecasts for the prospects of the economy. In this case, the bears' task is to break through and consolidate below the support of 1.1301, which will increase pressure on EUR/USD and lead to a return to the area of the lower border of the side channel at 1.1244, where I recommend taking profits. The entire upward trend that formed on May 25 will depend on a breakout of this level.

Signals of indicators:
Moving averages
Trading is conducted above 30 and 50 moving average, which indicates a possible continuation of the upward trend.
Note: The period and prices of moving averages are considered by the author on the hourly chart H1 and differs from the general definition of the classic daily moving averages on the daily chart D1.
Bollinger bands
In case the pair falls in the morning, support will be provided by the lower border of the indicator in the region of 1.1275. Growth may be limited by the upper level of the indicator in the area of 1.1375.
Description of indicators
- Moving average (moving average determines the current trend by smoothing out volatility and noise). Period 50. The graph is marked in yellow.
- Moving average (moving average determines the current trend by smoothing out volatility and noise). Period 30. The graph is marked in green.
- MACD indicator (Moving Average Convergence / Divergence - moving average convergence / divergence) Fast EMA period 12. Slow EMA period 26. SMA period 9
- Bollinger Bands (Bollinger Bands). Period 20
- Non-profit traders - speculators, such as individual traders, hedge funds and large institutions that use the futures market for speculative purposes and meet certain requirements.
- Long nonprofit positions represent the total long open position of nonprofit traders.
- Short nonprofit positions represent the total short open position of nonprofit traders.
- The total non-profit net position is the difference between short and long positions of non-profit traders.


