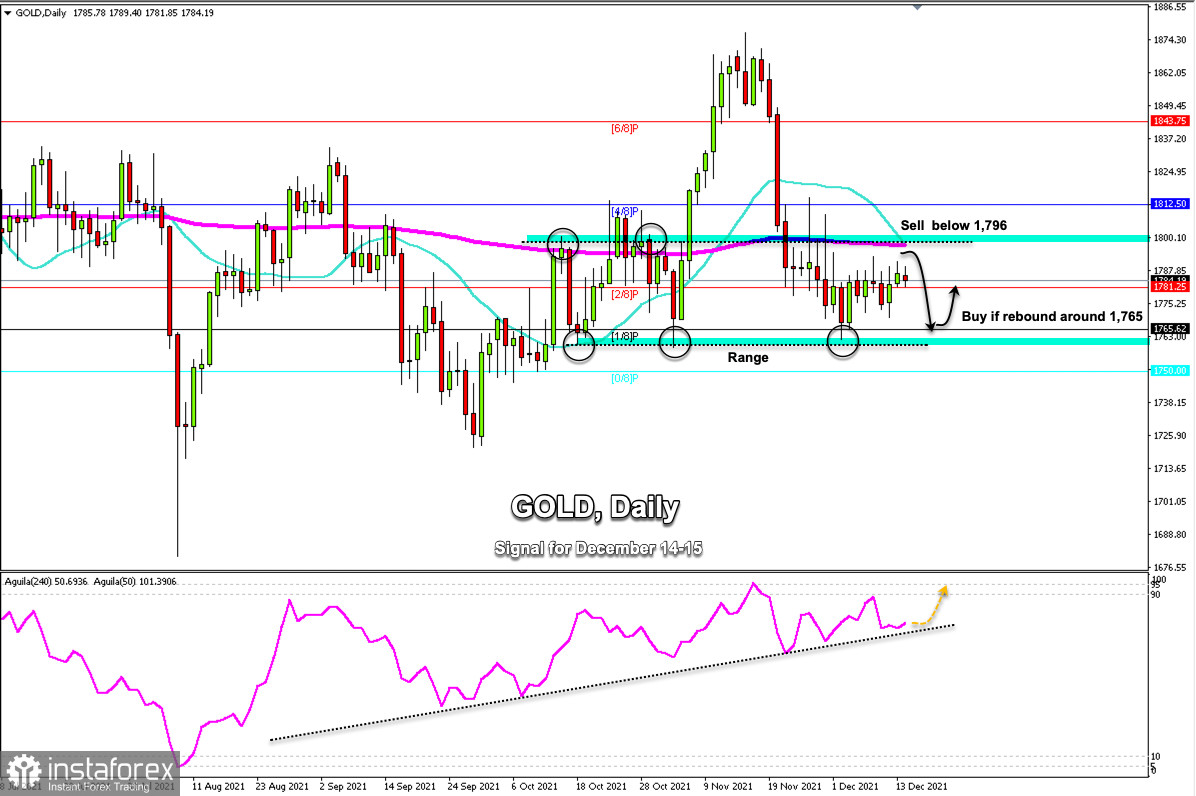
Since october 6, Gold (XAU/USD) has been trading within a range between the 200-day moving average and the support of 1/8 Murray at 1,765. The daily chart shows that gold could continue trading sideways in the next days.
The strong resistance of the 200 EMA and the psychological level of 1,800 has become strong resistance for Gold. A pullback towards this zone will be an opportunity to sell again with targets up to 1,765.
On the contrary, if gold falls and bounces around 1,765 or 1,761, we will have an opportunity to buy again with targets at 2/8 of Murray located at 1,781 and until 1,796.
Gold could remained trapped in the range until the end of the year due to the fact that the low liquidity of the market could cause low volatile movements and the commodity market will enter a consolidation period until the beginning of January 2022.
Above the EMA 200 and above the psychological level of 1,800, the dominant downward trend could change and the market could favor the recovery of Gold. It could so quickly reach 1,843.75 where the line of 6/8 of Murray is located that represents strong resistance.
The Eagle indicator continues giving a positive signal for gold, which favors a recovery if it falls to the area of 1,765. A daily close below 1,760 would quickly expect a drop to the zone of 0/8 Murray at 1,750 and until the low of September 29 at 1,721.
Support and Resistance Levels for December 14 - 15, 2021
Resistance (3) 1,800
Resistance (2) 1,793
Resistance (1) 1,786
----------------------------
Support (1) 1,772
Support (2) 1,765
Support (3) 1,758
***********************************************************
A trading tip for GOLD on December 14 - 15, 2021
Sell below 1,796 (200 EMA) with take profit at 1,781 (2/8) and 1,765 (1/8), stop loss above 1,801.


