To open long positions on GBPUSD, you need:
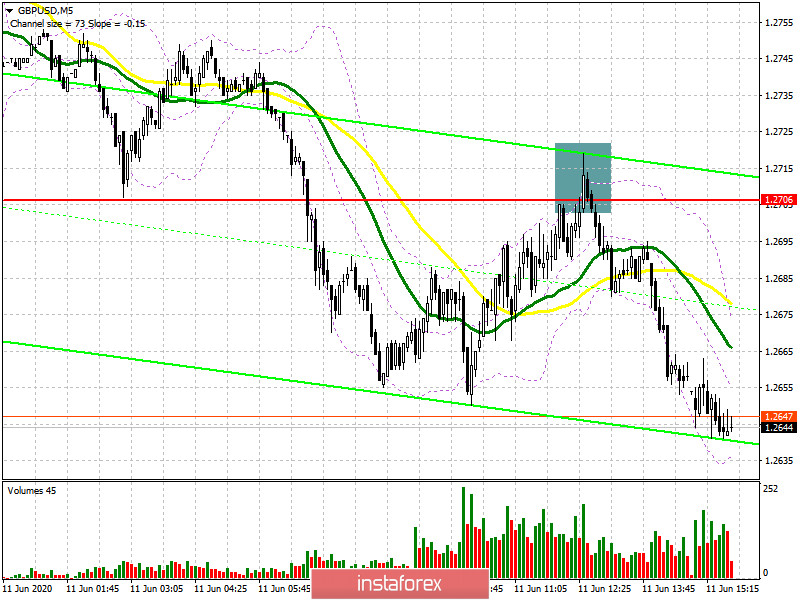
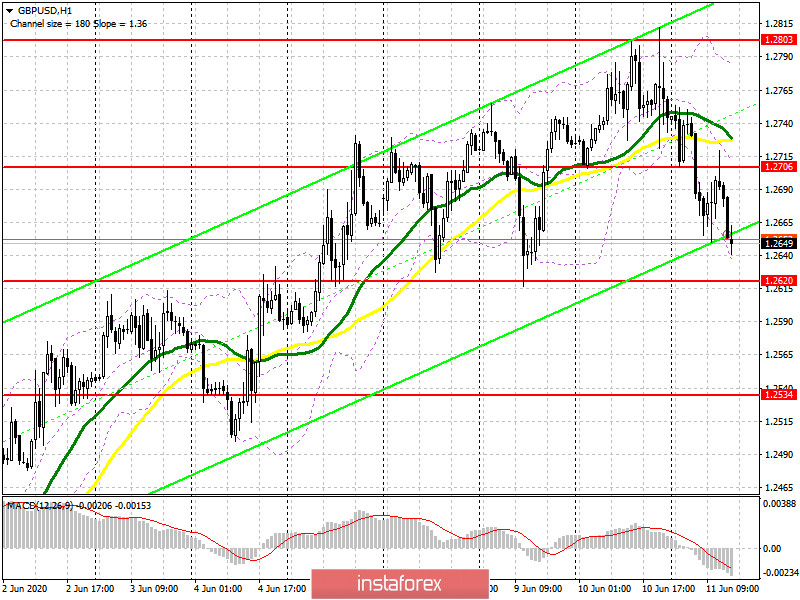
In the first half of the day, I paid attention to sales below the level of 1.2706. If you look at the 5-minute chart, you will see how a breakout and consolidation below this range, followed by a test of the level from the bottom up, became a pretty good signal to open short positions in order to continue the downward correction that was formed yesterday after the Federal Reserve meeting. At the moment, the task of buyers is to protect the support of 1.2620, which is now sought by sellers. However, I would recommend opening long positions from there only if a false breakout is formed. You can buy a pound immediately for a rebound only from a minimum of around 1.2534, calculated on a correction of 30-40 points within a day. An equally important task for buyers will be to close the day above the resistance of 1.2706, since only in this case can we expect an upward correction to the area of the weekly maximum of 1.2803, where I recommend fixing the profits.

To open short positions on GBPUSD, you need:
Sellers have taken control of the market and are trying their best to update the week's lows around 1.2620. However, only a consolidation below this level, by analogy with the resistance of 1.2706, will be a signal to open new short positions that can collapse the pound to the area of the lows of 1.2534 and 1.2439, where I recommend fixing the profits. If there are no active sales below 1.2620, it is best to give up the market to buyers and wait for a repeat test of the resistance of 1.2706, just above which the moving averages pass, gradually crossing each other and forming an additional signal to open short positions. With the growth of GBP/USD above the resistance of 1.2706 in the second half of the day, it is best to sell the pound on a rebound from the maximum of 1.2803 in the calculation of correction of 30-40 points within the day.

Signals of indicators:
Moving averages
Trading is below the 30 and 50 daily averages, which indicates the preservation of pressure.
Note: The period and prices of moving averages are considered by the author on the hourly chart H1 and differ from the general definition of the classic daily moving averages on the daily chart D1.
Bollinger Bands
If the pair grows in the second half of the day, the average border of the indicator around 1.2706 will act as a resistance, however, you can sell the pound on a rebound from the upper border in the area of 1.2780.
Description of indicators
- Moving average (moving average determines the current trend by smoothing out volatility and noise). Period 50. The graph is marked in yellow.
- Moving average (moving average determines the current trend by smoothing out volatility and noise). Period 30. The graph is marked in green.
- MACD indicator (Moving Average Convergence / Divergence - moving average convergence / divergence) Fast EMA period 12. Slow EMA period 26. SMA period 9
- Bollinger Bands (Bollinger Bands). Period 20


