


To open long positions on EURUSD, you need:
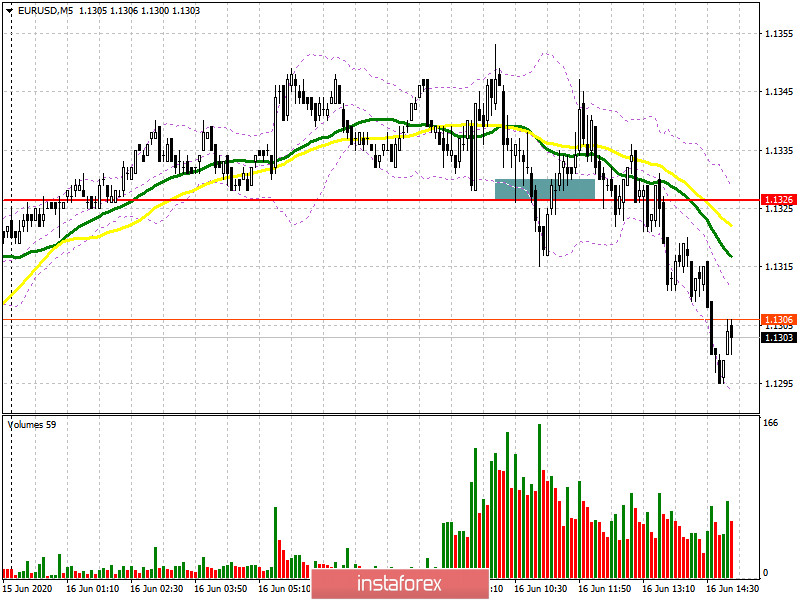
In the first half of the day, I paid attention to purchases from the level of 1.1326, provided that a false breakout is formed there in order to continue the upward trend of the pair, which was outlined at the beginning of this week. If you look at the 5-minute chart, you will see how the bulls managed to return the pair to the level of 1.1326 after the first test during the European session, which was a clear signal to buy the euro. However, unfortunately, this did not lead to a larger increase, and after a while, the bears managed to return the pair to the support of 1.1326 and then broke through it. At the moment, the main task of buyers will be to return and consolidate EUR/USD at the end of the day above the level of 1.1326, which will maintain upward momentum in the pair, and this can be helped by poor data on the volume of retail trade in the United States. If the pressure on the euro persists in the second half of the day and beyond, it is best not to rush to open long positions but wait for the update of the minimum of 1.1262, from which you can expect a rebound of 20-30 points. However, the larger support is still the area of 1.1187, where you can also buy the euro immediately on the rebound.
To open short positions on EURUSD, you need:
Sellers coped with the task and returned the euro to the level of 1.1326, however, it was not possible to wait for the formation of a convenient entry point into the market. At the moment, it is best to expect to open short positions after the bottom-up test of the level of 1.1326 and an unsuccessful attempt by buyers to regain this area after the release of data on retail trade in the United States. An equally important task for sellers is also to update the support of 1.1262, in the area of which the lower border of a new ascending channel in EUR/USD can be formed, so I recommend fixing profits there. The bears' longer-term goal is at least 1.1187. If the bulls regain the initiative in the North American session, it is best to postpone the sale of the European currency until the update of last week's maximum in the area of 1.1400, in the expectation of a rebound down 30-40 points from this level.
Signals of indicators:
Moving averages
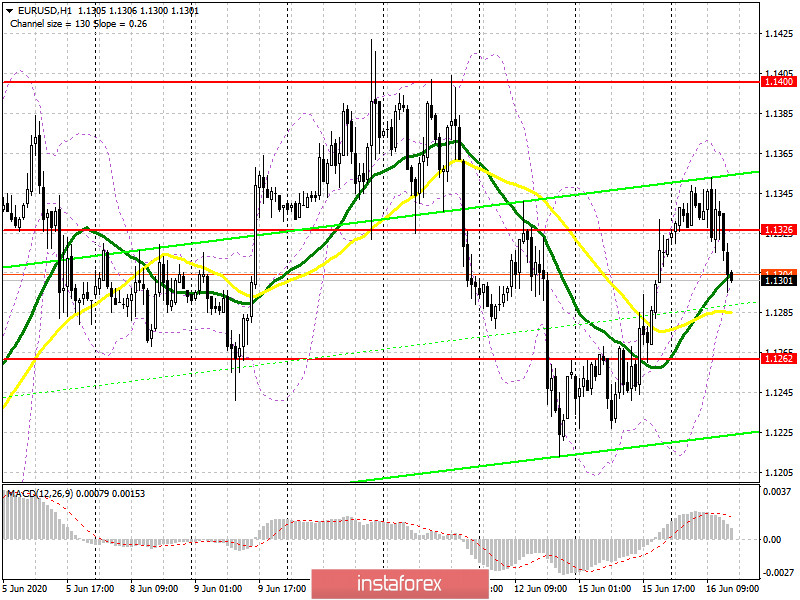
Trading is conducted in the area of 30 and 50 daily moving averages, and the task of the bears is to close the day below these levels.
Note: The period and prices of moving averages are considered by the author on the hourly chart H1 and differ from the general definition of the classic daily moving averages on the daily chart D1.
Bollinger Bands
A break in the lower border of the indicator in the area of 1.1305 may increase pressure on the euro. Growth will be limited to the upper level of the indicator around 1.1350.
Description of indicators
- Moving average (moving average determines the current trend by smoothing out volatility and noise). Period 50. The graph is marked in yellow.
- Moving average (moving average determines the current trend by smoothing out volatility and noise). Period 30. The graph is marked in green.
- MACD indicator (Moving Average Convergence / Divergence - moving average convergence / divergence) Fast EMA period 12. Slow EMA period 26. SMA period 9
- Bollinger Bands (Bollinger Bands). Period 20


