


To open long positions on EURUSD, you need:
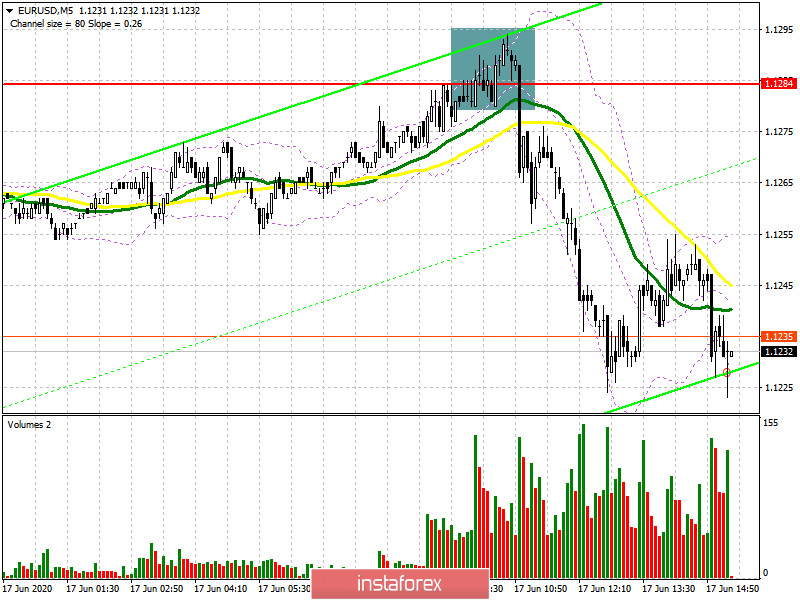
In the first half of the day, I paid attention to the resistance level of 1.1284 and recommended opening short positions from it in the continuation of the downward trend, which happened. If you look at the 5-minute chart, you will see how after a sluggish attempt by the bulls to return to the market and get above the resistance of 1.1284, the price returns to this area after the fundamental statistics on the Eurozone, which forms a signal to open short positions and leads to a rapid fall in the euro. The downward movement brought about 70 points. In the second half of the day, the bulls will focus on protecting the support of 1.1215, however, only the formation of a false breakout in this range will be a signal to buy the euro. If there is no upward movement and good data on the real estate market in the US, it is best to postpone long positions in EUR/USD until the new lows of 1.1164 and 1.1106 are updated, counting on a rebound of 30-40 points by the end of the day.
To open short positions on EURUSD, you need:
Sellers coped with the task and did not let the pair go above the resistance of 1.1284, forming a false breakout and a good sell signal there. The main goal for the second half of the day will be to test the lower border of the side channel 1.1215, however, we can only talk about the resumption of the downward trend in the euro after fixing below this level, which will quickly push the pair to new lows of 1.1164 and 1.1106, where I recommend fixing the profits. In the scenario of euro growth in the second half of the day after the data on the US economy and the state of the real estate market, it is best to wait for the update of the resistance of 1.1284 and re-open short positions if a false breakout is formed there. It is still best to sell EUR/USD immediately on a rebound after updating the larger maximum of 1.1349 in the expectation of a correction of 30-40 points within the day.
Signals of indicators:
Moving averages
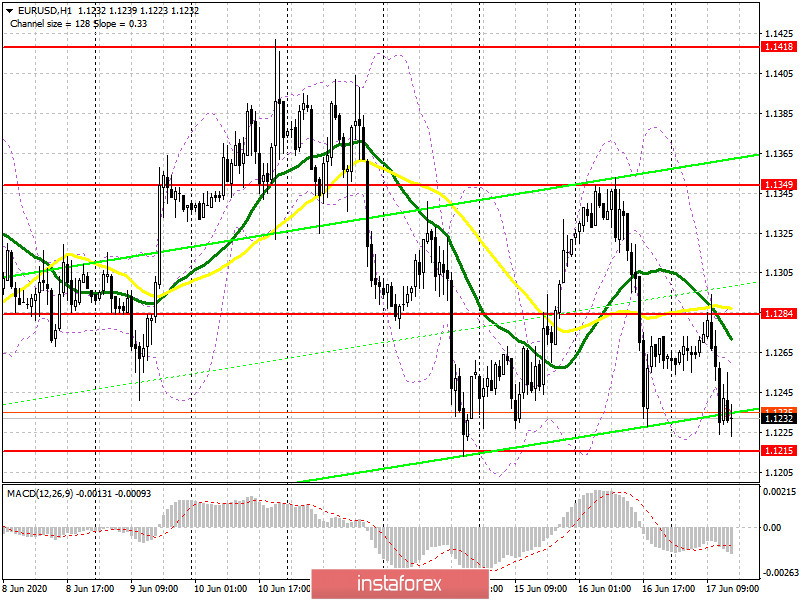
Trading is conducted below the 30 and 50 daily moving averages, which indicates that the pressure on the pair remains.
Note: The period and prices of moving averages are considered by the author on the hourly chart H1 and differ from the general definition of the classic daily moving averages on the daily chart D1.
Bollinger Bands
A break in the lower border of the indicator at 1.1230 may increase the pressure on the euro.
Description of indicators
- Moving average (moving average determines the current trend by smoothing out volatility and noise). Period 50. The graph is marked in yellow.
- Moving average (moving average determines the current trend by smoothing out volatility and noise). Period 30. The graph is marked in green.
- MACD indicator (Moving Average Convergence / Divergence - moving average convergence / divergence) Fast EMA period 12. Slow EMA period 26. SMA period 9
- Bollinger Bands (Bollinger Bands). Period 20


