


To open long positions on EURUSD, you need:
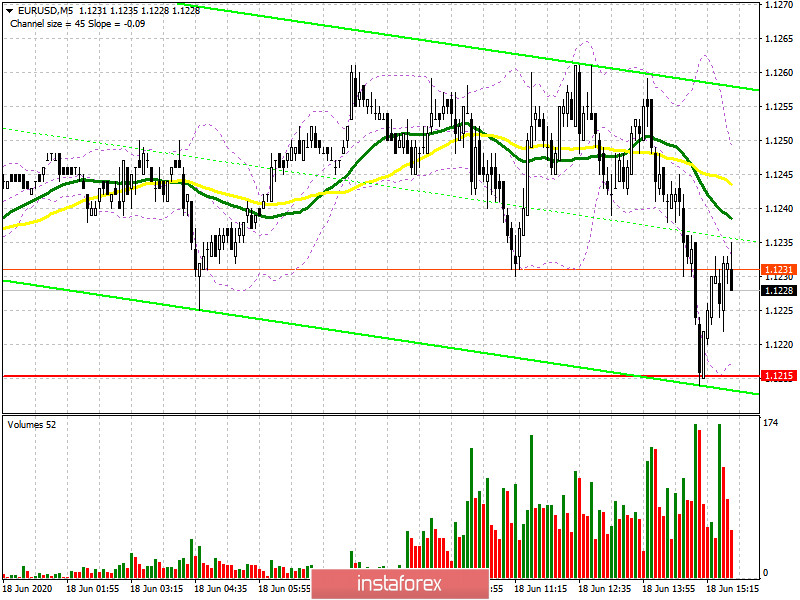
In the first half of the day, trading was conducted in a fairly narrow side channel against the background of the absence of important fundamental statistics, and neither buyers nor sellers showed much activity. If you look at the 5-minute chart, the bulls did not pull the pair into the resistance area of 1.1284, but, on the contrary, retreated again to the lower border of the side channel of 1.1215, where trading is currently being conducted. By the way, the test of this level has already led to a rebound of the pair up, and its protection remains a priority for buyers of the European currency. In the absence of further upward movement and good data on the US labor market, it is best to postpone long positions in EUR/USD until the new lows of 1.1164 and 1.1106 are updated, in the expectation of a rebound of 30-40 points by the end of the day. An equally important task for the bulls will be the return of EUR/USD to the resistance and its breakdown, which will lead to a new upward wave to the highs of 1.1349 and 1.1418, where I recommend fixing the profits.
To open short positions on EURUSD, you need:
The main goal for the second half of the day will be to test the lower border of the side channel 1.1215, however, we can only talk about the resumption of the downward trend in the euro after fixing below this level, which will quickly push the pair to new lows of 1.1164 and 1.1106, where I recommend fixing the profits. In the scenario of euro growth in the second half of the day after the data on the US economy and the state of the labor market, it is best to wait for the update of the resistance of 1.1284 and re-open short positions if a false breakout is formed there. It is still best to sell EUR/USD immediately on a rebound after updating the larger maximum of 1.1349 in the expectation of a correction of 30-40 points within the day.
Signals of indicators:
Moving averages
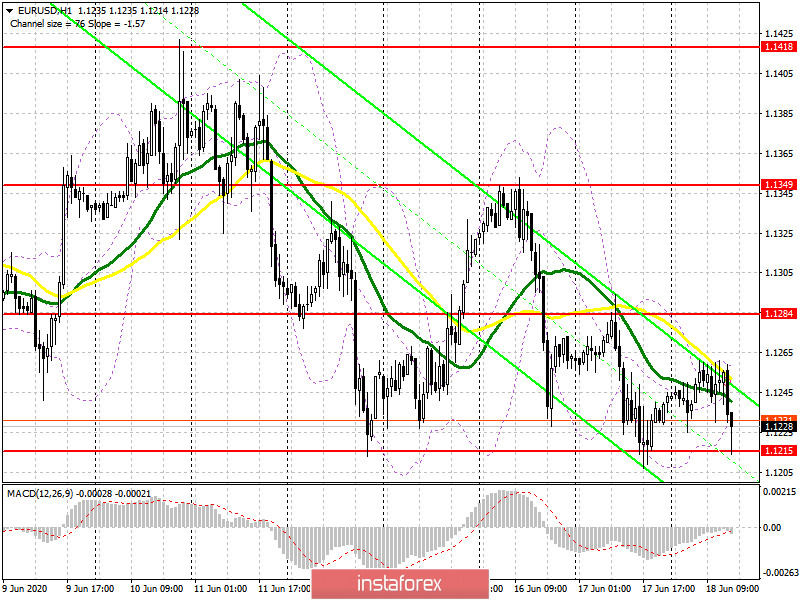
Trading is conducted below the 30 and 50 daily moving averages, which indicates that the pressure on the pair remains.
Note: The period and prices of moving averages are considered by the author on the hourly chart H1 and differ from the general definition of the classic daily moving averages on the daily chart D1.
Bollinger Bands
A break in the lower border of the indicator in the area of 1.1225 may increase pressure on the euro.
Description of indicators
- Moving average (moving average determines the current trend by smoothing out volatility and noise). Period 50. The graph is marked in yellow.
- Moving average (moving average determines the current trend by smoothing out volatility and noise). Period 30. The graph is marked in green.
- MACD indicator (Moving Average Convergence / Divergence - moving average convergence / divergence) Fast EMA period 12. Slow EMA period 26. SMA period 9
- Bollinger Bands (Bollinger Bands). Period 20


