


To open long positions on GBPUSD, you need:
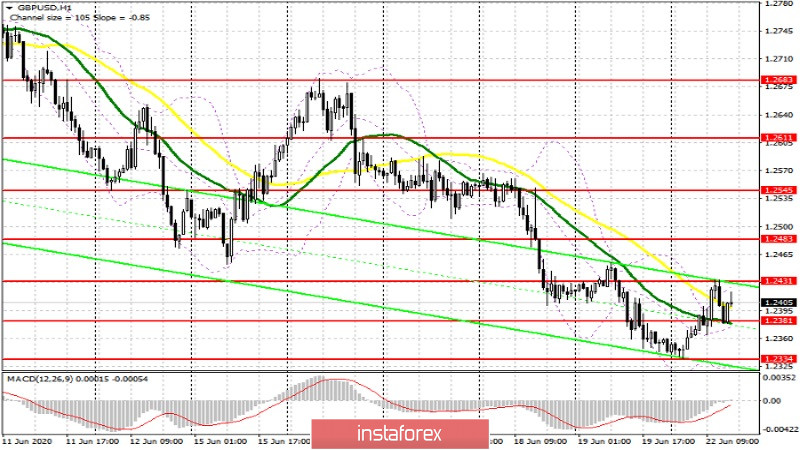
Buyers of the British pound need to cope with the resistance of 1.2431, which was formed today in the morning. And although the bulls managed to recoup most of Friday's losses, there is a chance that the upward momentum may continue in the afternoon. However, it is possible to talk about new purchases only after a breakout and consolidation above the level of 1.2431, which will open a direct path to the highs of 1.2483 and 1.2545, where I recommend fixing the profits. Buyers should also not forget about protecting the support of 1.2381, since only the formation of a false breakout on it will be a signal to open long positions in the expectation of continuing the upward trend. If there is no activity on this damage during the next test, it is best to postpone purchases until the next update of this week's minimum in the area of 1.2334, and then only in the expectation of a correction of 30-40 points within the day, since a repeated test of this range will indicate the continuation of the bearish trend formed on June 9 this year.
To open short positions on GBPUSD, you need:
Bears are not in a hurry to return to the market after Friday's volatility, and the first sales from the level of 1.2431, or rather the closing of morning purchases, so far indicate a wait-and-see position of major players. In the North American session, I recommend opening short positions only after another unsuccessful attempt by the bulls to get above the resistance of 1.2431. However, the more important task is to return the pound/dollar pair to the support level of 1.2381, the breakout of which will increase pressure on the pair and lead to a repeated return to the area of the week's minimum of 1.2334, where I recommend fixing the profits. In the scenario of the pound's growth in the second half of the day above the resistance of 1.2431, sales will be relevant only after the resistance test of 1.2483, counting on a correction of 30-40 points by the close of the day.
Signals of indicators:
Moving averages
Trading is conducted in the area of 30 and 50 daily averages, which indicates that the market has returned to balance, however, the sellers remain in control.
Note: The period and prices of moving averages are considered by the author on the hourly chart H1 and differ from the general definition of the classic daily moving averages on the daily chart D1.
Bollinger Bands
A break in the upper limit of the indicator around 1.2431 will strengthen the demand for the pound. Breaking the lower border of the indicator in the area of 1.2381 will lead to another wave of decline in the pair.
Description of indicators
- Moving average (moving average determines the current trend by smoothing out volatility and noise). Period 50. The graph is marked in yellow.
- Moving average (moving average determines the current trend by smoothing out volatility and noise). Period 30. The graph is marked in green.
- MACD indicator (Moving Average Convergence / Divergence - moving average convergence / divergence) Fast EMA period 12. Slow EMA period 26. SMA period 9
- Bollinger Bands (Bollinger Bands). Period 20


