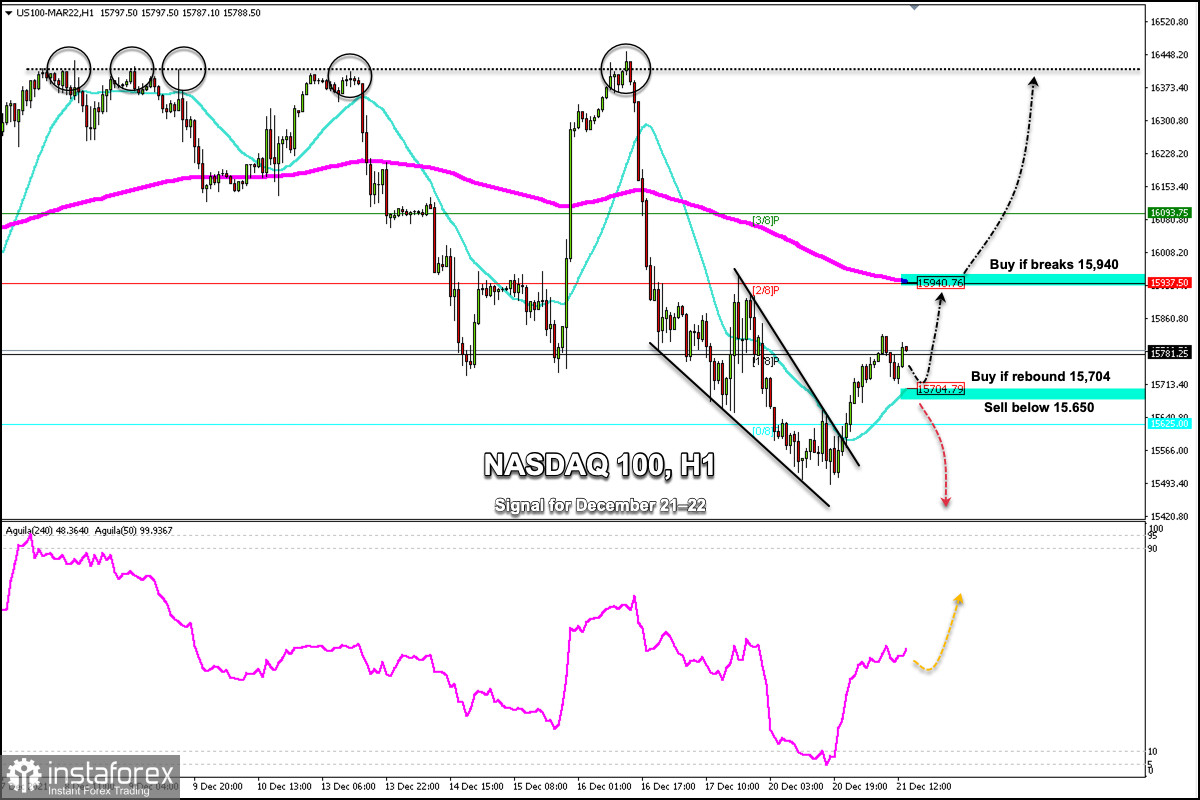
NASDAQ 100 (#NDX) formed a descending wedge pattern. On December 20, this technical figure was broken and the index consolidated above 0/8 of Murray and above the 21 SMA.
The eagle indicator touched the 5-point level that represents extreme oversold conditions. The NASDAQ 100 rebounded from the level of 15,495 . It is likely to continue its upward movement in the next few hours until it finds resistance at the 200 EMA located at 15,940.
A breakout and consolidation above the 2/8 Murray and above the 200 EMA around 15,940 will be an opportunity to continue buying with targets at the strong resistance at 16,400.
As we can see in the 1-hour chart, since the beginning of December, the NASDAQ has been testing this strong resistance and failed to break. Each time it approaches, a technical correction starts.
On the contrary, if the NASDAQ index falls below 15,704 (21 SMA) and below 0/8 of Murray (15,625) it could continue its downward movement and reach the key support of 15,312 (5/8).
Our trading plan for the next few hours is to buy as long as the NASDAQ 100 remains above 0/8 of Murray located at 15,704, with targets at 15,940, 16,093 and 16,400. The eagle indicator is giving a positive signal and could favor our bullish outlook.
Support and Resistance Levels for December 21 - 22, 2021
Resistance (3) 16,250
Resistance (2) 16,028
Resistance (1) 15,851
----------------------------
Support (1) 15,625
Support (2) 15,494
Support (3) 15,312
***********************************************************
A trading tip for NASDAQ 100 on December 21 - 22, 2021
Buy in case of a rebound at 15,704 (21 SMA) with take profit at 15,937 (200 EMA) and 16,400 (strong resistance), stop loss below 15,610.


