


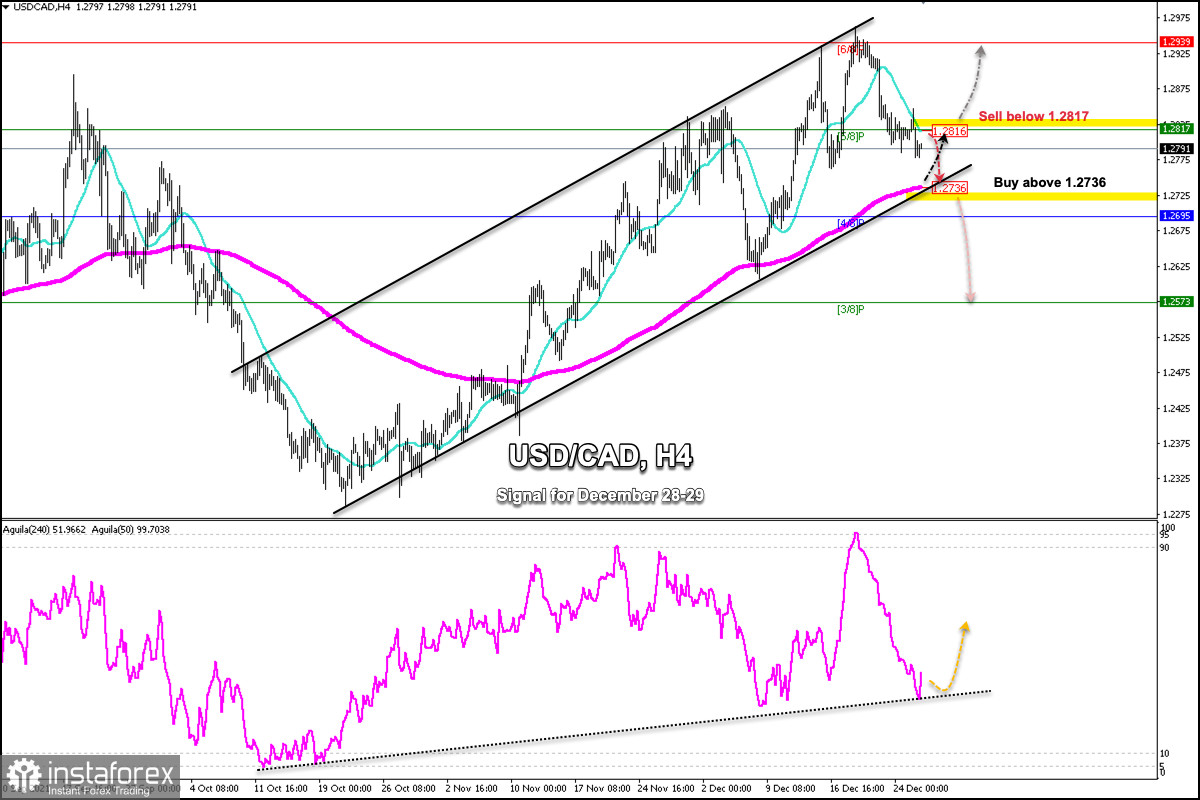
USD/CAD is trading below the 21 SMA and below the 5/8 Murray with a bearish bias. On December 20, it reached strong resistance at 6/8 by Murray and the top of the bull channel. From that level, it is making a technical correction that could find a strong technical bounce around the 200 EMA and around the bottom of the uptrend channel.
The trend remains bullish according to the 4-hour chart formed from October 19. A technical bounce at the bottom line of the bullish channel is expected, which could give it new bullish momentum. The pair could again reach the levels of 1.2817 and 1.2939.
On the contrary, a sharp break and a consolidation on the 4-hour chart below 1.2736 could open the possibility of a downward correction in the medium term to the level of 1.2573 and to the psychological level of 1.2500.
This week due to the New Year holidays, the trading volumes will continue to be low and for the restart of activities next year. It is likely that the market will gradually increase the volume. Therefore, USD/CAD is expected to consolidate below the 21 SMA and above the 200 EMA and trade sideways.
The range between 1.2816 -1. 27 36 could be the zone in which the loonie will be trading these days. An upper break above the top of the range or a lower break below the support of the range, we could see an acceleration of the downward movement to 1.25 or resume the upward movement to 1,3000.
The eagle indicator is oscillating within an uptrend channel showing that this correction could be taken advantage of by the market. As long as it remains above the 200 EMA the loonie is expected to resume its uptrend and it will be a good point to buy around 1.2736.
Our trading plan for the next few days is to sell below 1.2816 with the target level at 1.2736. On the other hand, a technical bounce around 1.2736 at the bottom of the uptrend channel will give us an opportunity to buy with targets at 1.2817. If this strong resistance of 6/8 of Murray is broken, it could go up to the psychological level of 1.3000.


