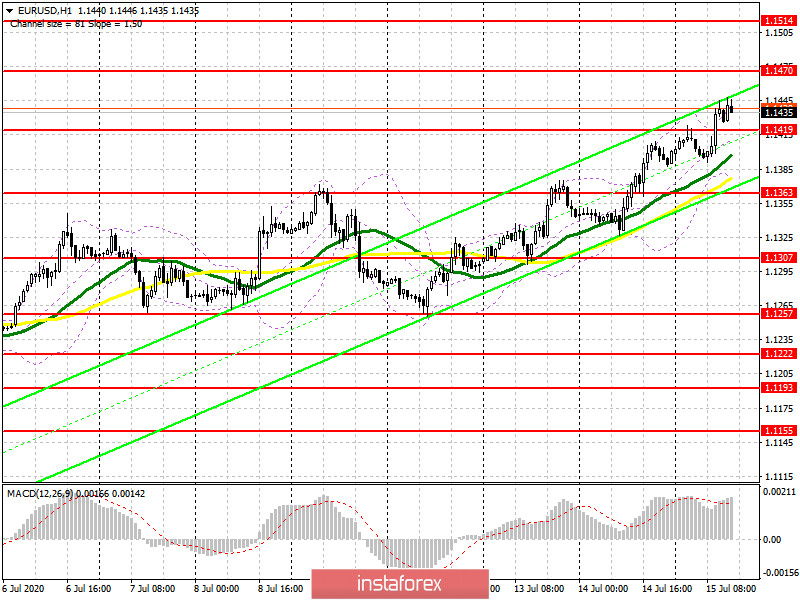
To open long positions on EURUSD, you need:
In the first half of the day, there was a breakdown and consolidation above the resistance of 1.1419, which served as a signal to enter the market for the continuation of the upward trend formed at the end of last week. If you look at the 5-minute chart, you will see how the bulls are breaking above the area of 1.1419, which forms a good point to enter the market. The next target for euro buyers is the resistance of 1.1462, a break above which will provide EUR/USD with a direct path to the maximum of 1.1514, where I recommend fixing the profits. The growth of the euro can be provided by good data on industrial production in the United States, however, they should be better than the forecasts of economists. If the bullish momentum begins to fade in the second half of the day, and the bears return the pair to the support of 1.1419, it is best to postpone long positions to rebound from the low of 1.1363 in the expectation of a correction of 25-30 points within the day. Larger support is seen around 1.1307.

To open short positions on EURUSD, you need:
Sellers did not even try to keep the pair below the level of 1.1419 in the first half of the day and retreated from the market at the first test. This once again confirms the absence of those willing to sell the euro even at current highs. The task for the North American session will be to return EUR/USD to the level of 1.1419, which may lead to profit taking on long positions and increase pressure on the euro. In this scenario, we can expect the pair to return to the area of major support of 1.1363, where I recommend fixing the profits, since the lower border of the current ascending channel passes in this range, and there are also moving averages. The bears' longer-term goal remains at least 1.1307, however, it is still very early to talk about it. When you save a bull market, it is better not to hurry with the sales against the trend and wait for the formation of a false breakout near the resistance of 1.1470 or open a short position once the rebound from the high of 1.1514 based on the correction of 25-30 points intraday.

Signals of indicators:
Moving averages
Trading is conducted above the 30 and 50 daily moving averages, which indicates the bullish nature of the market.
Note: The period and prices of moving averages are considered by the author on the hourly chart H1 and differ from the general definition of the classic daily moving averages on the daily chart D1.
Bollinger Bands
If the euro falls in the second half of the day, the lower border of the indicator in the area of 1.1370 will provide support.
Description of indicators
- Moving average (moving average determines the current trend by smoothing out volatility and noise). Period 50. The graph is marked in yellow.
- Moving average (moving average determines the current trend by smoothing out volatility and noise). Period 30. The graph is marked in green.
- MACD indicator (Moving Average Convergence / Divergence - moving average convergence / divergence) Fast EMA period 12. Slow EMA period 26. SMA period 9
- Bollinger Bands (Bollinger Bands). Period 20


