


Ethereum is trading around $3,790. There is a big battle going on the last few sessions between $4,000 and $3,800. Price so far has been respecting the upward sloping trend line support coming from $1,711, but yesterday we saw it being broken.
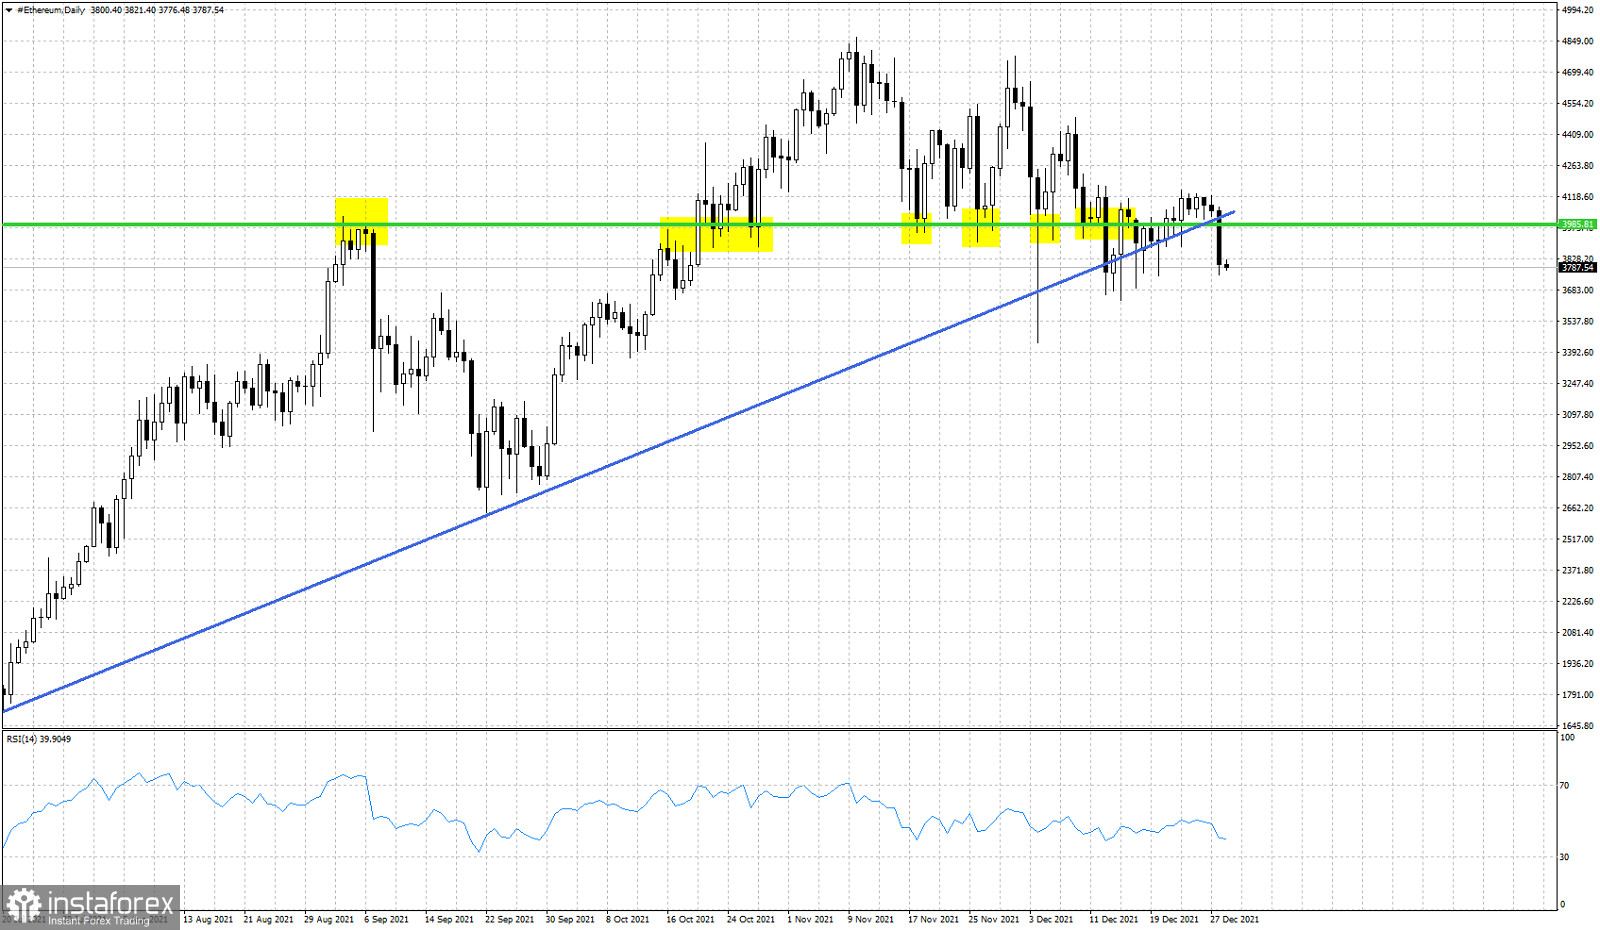
Green line - horizontal support
Blue line - trend line support
Yellow rectangles- multiple tests of horizontal support
Ethereum has most probably formed a lower high around $4,148 and is now turning lower below $3,800. This is a bearish sign. Inability to hold above the horizontal support and above the blue trend line, imply that more downside should be expected. Ethereum next support is at $3,700 and our most probable target is at $3,000-$3,200 if price fails to hold above $3,700. Bulls need to recapture at least the $4,000 level in order to avoid any pull back.


