Hello!
In today's review of the dollar/yen currency pair, we will mainly consider the technical picture and price charts of this instrument. As you know, at the height of the COVID-19 epidemic, the US dollar was in the highest demand among investors as a safe asset. However, the situation has changed recently, and "American" is out of favor with investors. However, in the United States itself, the coronavirus continues to rage, especially in states such as Florida, Texas, and California.
Weekly

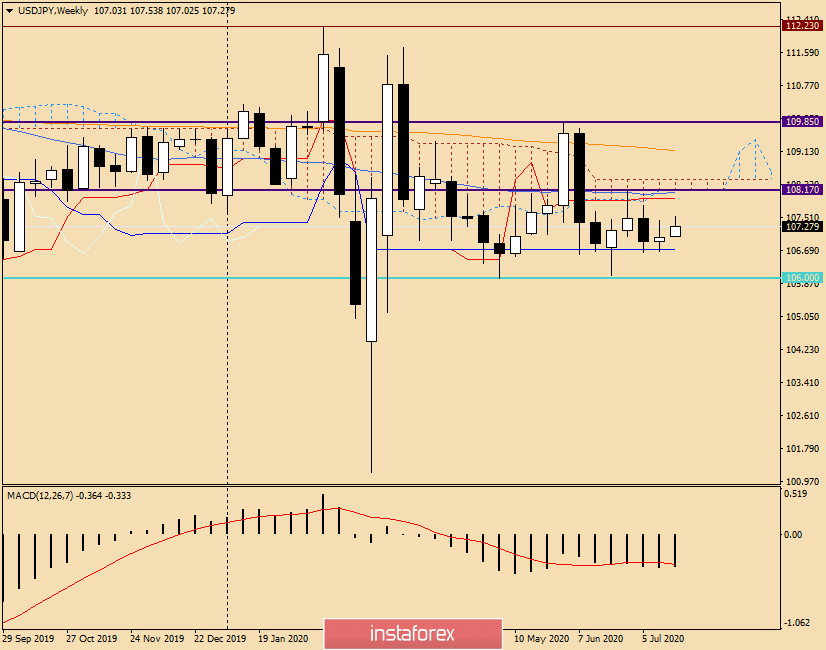
At the trading of the past five days, the USD/JPY currency pair did not show a clearly defined price direction. Trading on July 13-17 ended with a very modest strengthening of the quote, just 0.08%.
The strong technical level of 106.65 and the Kijun line of the Ichimoku indicator continue to provide strong support to the price. However, even after going lower, much will be decided by the bears' ability to push through the landmark level of 106.00. So, the support zone on the weekly timeframe is in the area of 106.65-106.00.
Now about the resistance of sellers. As can be seen on the chart, it takes place in the price zone of 107.80-108.17, where the maximum values of several previous weekly trades are marked. It should also be noted that the indicated resistance zone contains the Tenkan line, the 50 simple moving average, and the lower border of the Ichimoku cloud. I believe that all of the above together represent serious obstacles for players to increase the rate. At the moment, the pair is trading in a relatively narrow price range. A bear market for USD/JPY will indicate a true breakout of the important mark of 106.00. Bullish sentiment will significantly strengthen after the breakout of sellers' resistance at 108.17 and consolidation above this level.
Daily

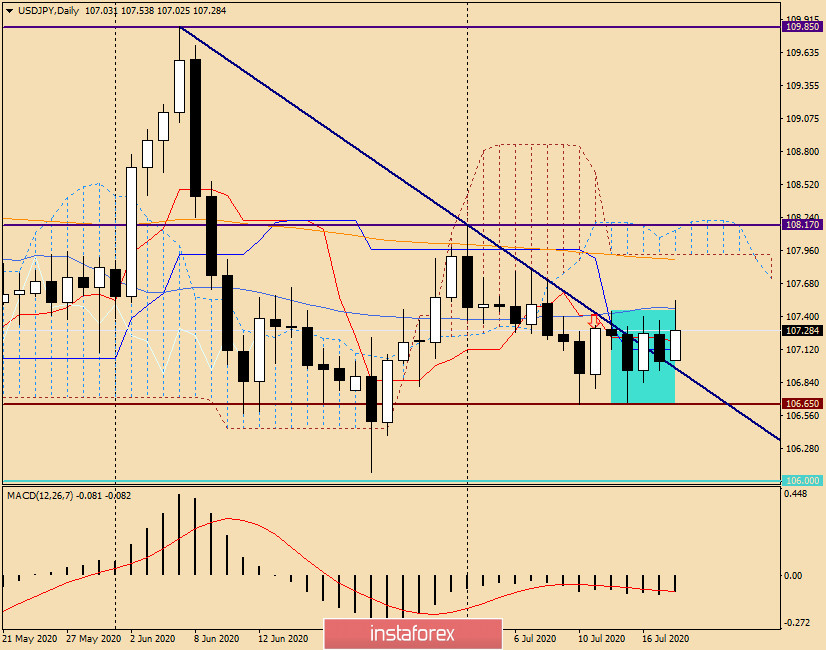
On the daily chart, the picture does not add much clarity. Moreover, there is an obvious consolidation in the selected area. It is also worth noting that the breakdown of the resistance line 109.85-107.80 can not take place. Of course, the growth is hindered by the Tenkan and Kijun lines of the Ichimoku indicator, as well as the 50 simple moving averages.
If this is a consolidation, it will end sooner or later, after which we can count on a good directional price movement. In most cases, this is exactly what happens. However, this currency pair differs in its originality, since both the US dollar and the Japanese yen, depending on the situation, are used by market participants as safe-haven currencies.
If you choose an ascending scenario, the USD/JPY pair can rise to the price area of 107.88-107.93, where the 144 exponential moving average and the lower limit of the daily cloud of the Ichimoku indicator pass.
In the case of a bearish scenario, the pair will return to the cut resistance line of 109.85-107.80, after which it will once again test the support level of 106.65 for a break. As noted above, a true break of this level will open the way to 106.00, where the further direction of the quote will be decided.
If we go to the trading recommendations, then, to be honest, the situation is quite uncertain. For novice traders and those who do not want to take risks, I recommend that you stay out of the market for USD/JPY for the time being. For those who want to trade this currency pair, I recommend that you consider the nearest purchases after a decline in the price zone of 107.20-107.00. You can look for further guidance for opening long positions after a decline to 106.65. Just keep in mind that this support has already been tested twice for a breakdown and both times repelled bear attacks, so each subsequent approach to this level is fraught with its breakdown.
I recommend considering sales after the corresponding candle signals appear on daily, H4, and (or) H1 in a strong price zone of resistance 107.80-108.20. That's all for now. Perhaps we will return to the consideration of this trading instrument in a few days.
Good luck!


