


Trend analysis (Fig. 1).
The market may continue to move upward from the level of 1.1557 (closing of yesterday's daily candle) with the target at 1.1596 - a 50% pullback level (blue dotted line). There is a possibility that the price may roll back down from this level.
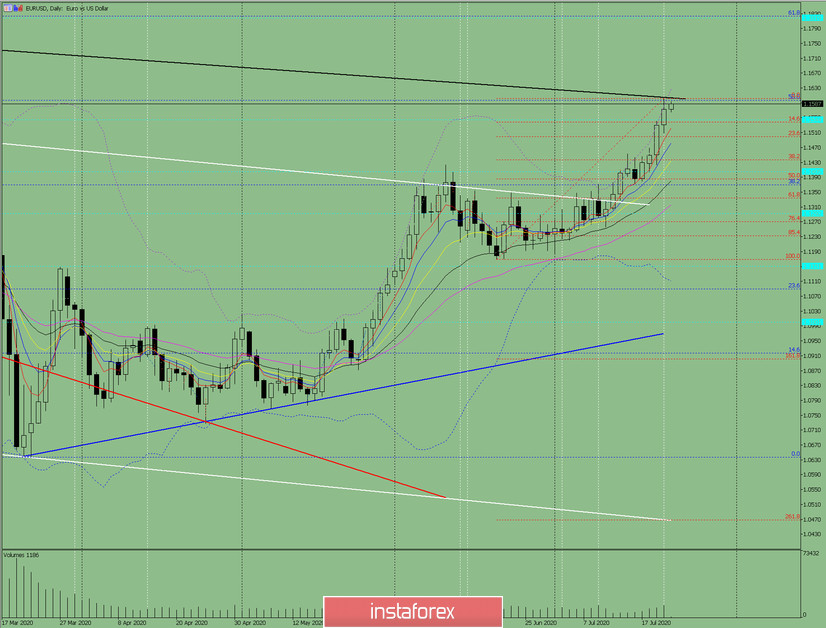
Fig. 1 (daily chart).
Comprehensive analysis:
- Indicator analysis - up;
- Fibonacci levels - down;
- Volumes - down;
- Candlestick analysis - down;
- Trend analysis - down;
- Bollinger lines - down;
- Weekly chart - down.
General conclusion:
Today the price may continue to move upward from the level of 1.1572 (closing of yesterday's daily candle) with the target of 1.1596 - a 50.0% pullback level (blue dashed line). There is a possibility that the price may roll back down from this level, with the next target at 1.1539 - a 14.6% pullback level (red dotted line).
Another possible scenario is a continuous upward trend after testing 1.1596 - a 50.0% pullback level (blue dashed line) with the target of 1.1823 - a 61.8% retracement level (blue dashed line).


