Technical analysis recommendations for EUR/USD and GBP/USD on July 24
EUR / USD

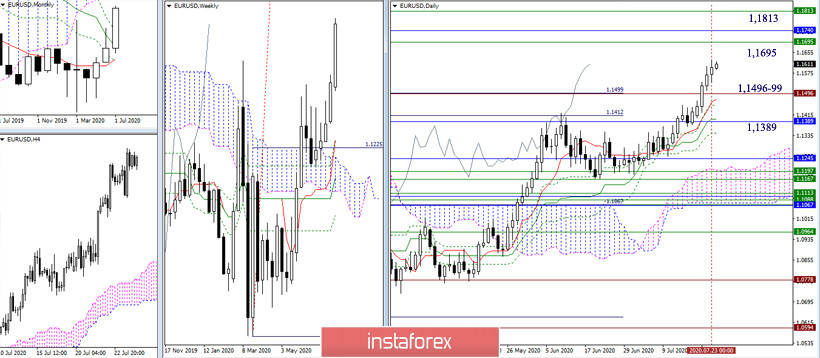
Despite the fact that the performance of the movement has significantly declined, the bulls still form a new maximum every day, continuing to rise. The situation with the location and value of supports and resistances has not changed. Upward guidance remains focused on the boundaries of 1.1695 - 1.1740 - 1.1813 (target for the breakdown of the weekly cloud + the lower border of the monthly cloud). The supports are still located at 1.1496-99 (100% target completion for the breakout of the daily cloud + the maximum extreme of the March High Wave + daily Tenkan) and 1.1389 (daily Kijun + monthly Fibo Kijun).

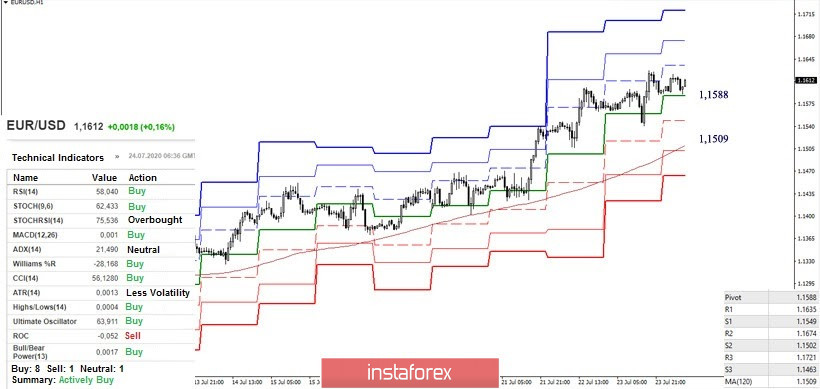
The bulls keep the advantage on lower time frames. All analyzed technical instruments are now on the bullish side. The resistance of the classic pivot levels (1.1635 - 1.1674 - 1.1721) serves as benchmarks for the continuation of the upward trend within the day. The nearest support is the central Pivot level (1.1588). A consolidation below will allow us to consider the development of the downward correction to the weekly long-term trend (1.1509), nearest support can be noted at 1.1549 (S1). Since the weekly long-term trend is strengthening from the levels of the upper halves (1.1496-99), breaking through this may have longer and more significant consequences for the development of the current movement.
GBP / USD

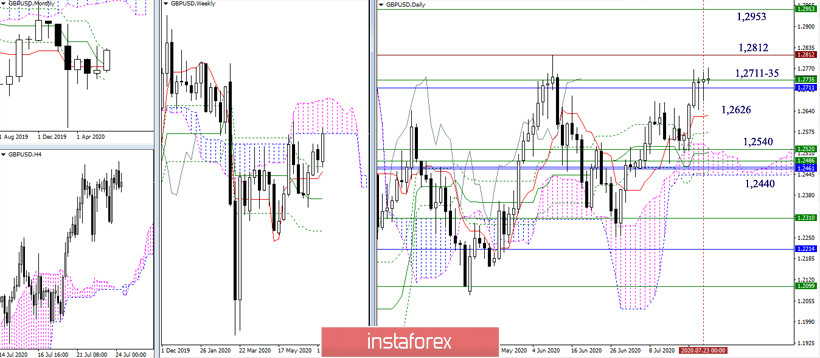
The resistances encountered at 1.2711-35 (monthly Fibo Kijun + weekly Senkou Span B) continue to exert attraction, not allowing either side to reach a clear result. The interests of the players to increase are still aimed at breaking through 1.2711-35, then at updating the June high (1.2812) and rising to the upper border of the weekly cloud (1.2953). For the bearish traders now, it is first of all important to overcome the pull of 1.2711-35 and securely consolidate below, then on the way to the accumulation of the most significant levels for this area 1.2540 - 1.2440 (day cloud + final borders of the daily gold cross + weekly levels + monthly cross of Ichimoku) support of the daily short-term trend (1.2626) may be important.

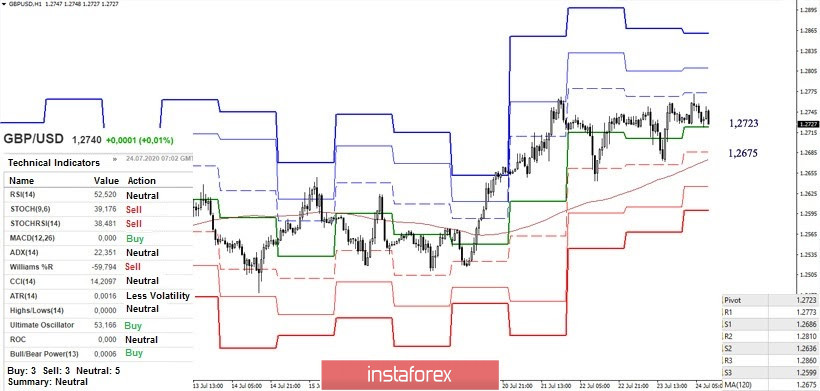
The players to increase updated the maximum, but failed to achieve more - a pause and a correction again. At the moment, the support of the central pivot level (1.2723) is being tested at H1. The next bearish reference awaits the pair at 1.2675 (weekly long-term trend). Anchoring below can inspire the bears for further exploits, since at the same time, they will be able to decline under the 1.2711-35 higher halves. A secure anchor below will allow you to make new plans. The next downside targets within the day may be the support of the classic pivot levels 1.2636 (S2) and 1.2599 (S3).
Ichimoku Kinko Hyo (9.26.52), Pivot Points (Classic), Moving Average (120)


