Do you remember how the main event at the beginning of last week was the discussion of the financial support plan for the eurozone economy affected by the coronavirus? We can say that this marked the beginning of a real rally. Since then, the single European currency has only been growing. So, this time it is the US' turn to start adopting its plan to support the economy. However, the result for the dollar is diametrically opposite. All these political dances only contribute to weakening it further. And we must admit that it is not groundless. The United States has decided to creatively approach the issue of saving its own economy. Apparently, subsidizing educational loans can still somehow be added to rescuing the economy affected by the epidemic, along with that, the stimulus proposal also includes the administration's request for funds for constructing a new FBI headquarters, which is completely unclear as it is unrelated. And there are plenty of similar items there. In general, it seems that this document has nothing to do with the economy and the pandemic. But we are talking about as much as one trillion dollars that they want to throw away.

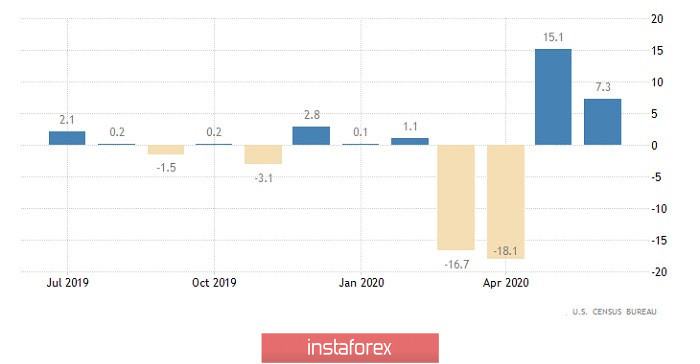
At the same time, US data began to please again, and orders for durable goods increased by 7.3%. Despite the fact that the projected growth is 5.0%. But investors were far more worried about strange initiatives to support the economy. So such good macroeconomic data went unnoticed.
Durable Goods Orders (United States):

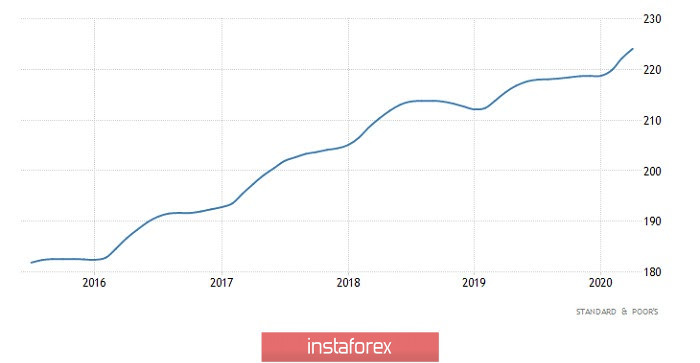
Significant macroeconomic data will not be released today. The most significant indicator is the S&P/CaseShiller Home Price Index, which should show an acceleration in the rate of growth in property prices from 4.0% to 4.1%. But with all due respect to this indicator, it has practically no influence on the market. So investors will be guided by how the process of discussing a brilliant plan to save the American economy will go in Congress.
S&P/CaseShiller Home Price Index (United States):

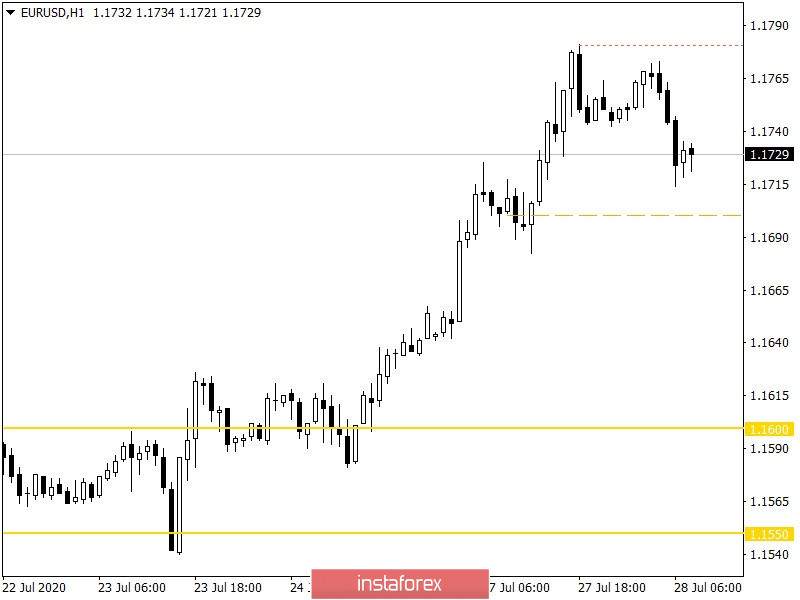
The euro/dollar pair continues daily updates of the annual high, where this time, the 1.1780 level became the variable point of resistance, relative to which there was a slowdown and as a fact a pullback. It is difficult to hide how the US dollar is oversold, but this does not stop speculators, as soon as the previous day's high breaks through, local inertia occurs and so on day after day.
In terms of dynamics, high volatility indicators are maintained, which confirms the fact that speculators are in the market.
Looking at the trading chart in general terms (daily period), you can see a recovery of more than 55% relative to the medium-term downward trend from 2018, which indicates a change in the trend, in terms of technical analysis.
We can assume that if the pullback period is delayed and the price is pinned lower than 1.1700, a full-fledged correction may occur in the direction of 1.1650-1.1600. Otherwise, we expect another rebound in the price, where a new round of ascending positions will occur if the price is pinned higher than 1.1780.
From the point of view of a complex indicator analysis, we see that the indicators of technical instruments on one-minute intervals signal a sell due to a pullback. Hourly and daily intervals signal buying due to the rapid upward movement of the price.


