


Trend analysis (Fig. 1).
The market may begin to move downward from the level of 1.1793 (closing of yesterday's daily candle) with the target of 1.1714 - a 14.6% pullback level (red dotted line). From this level, there is a possibility that the price may continue to move downward with the next target at 1.1657 - a 23.6% pullback level (red dotted line).
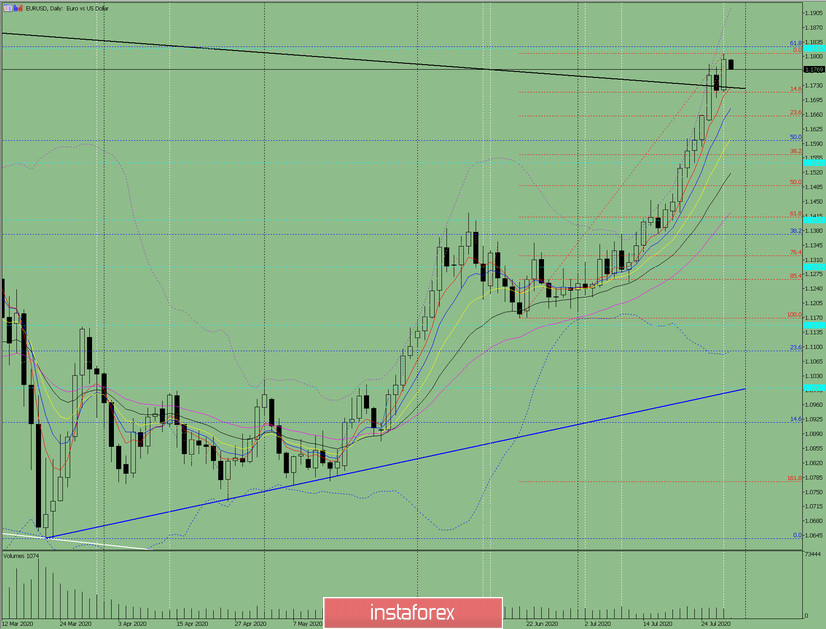
Fig. 1 (daily chart).
Comprehensive analysis:
- Indicator analysis - down;
- Fibonacci levels - down;
- Volumes - down;
- Candlestick analysis - down;
- Trend analysis - down;
- Bollinger lines - down;
- Weekly chart - down.
General conclusion:
Today the market may begin to move downward from the level of 1.1793 (closing of yesterday's daily candle) with the target of 1.1714 - a 14.6% pullback level (red dotted line). From this level, there is a possibility that the price may continue to move downward with the next target at 1.1657 - a 23.6% pullback level (red dotted line).
Another possible scenario is, after testing 1.1714 - a 14.6% pullback level (red dotted line) the price may begin to move upward with the target at the upper fractal 1.1807 (red dotted line).


