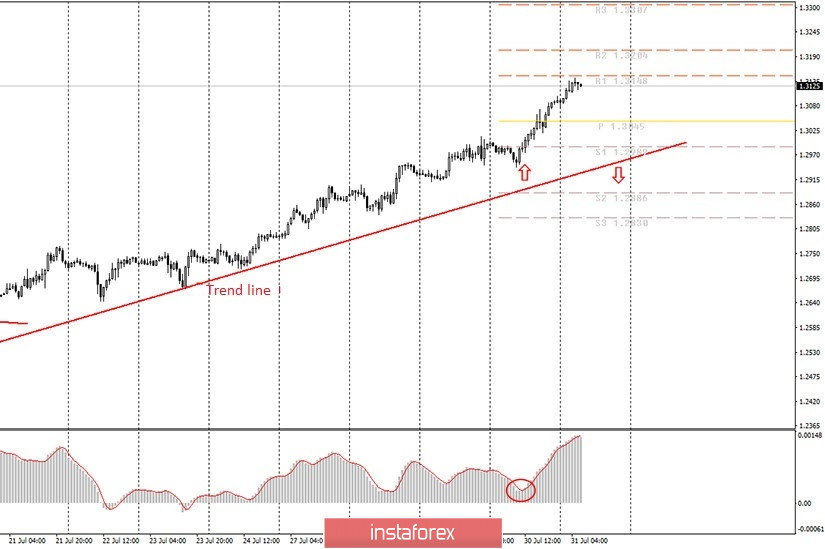
Hourly chart of the GBP/USD pair

Everything remains stable and works like a clock for the GBP/USD pair. The upward trend line clearly shows which direction the pair is currently moving and in which direction it is necessary to trade. The price has not even approached the trend line during all this time, which indicates the strength of the movement. Yesterday, after another reversal of the MACD indicator upward, the upward movement resumed, and at the moment the quotes approached the first resistance level on July 31 at 1.3148. Thus, novice traders are advised to wait for new buy signals and be prepared for a possible correction to the trend line today.
We have already analyzed yesterday's important macroeconomic statistics in the EUR/USD article, please read it. In this article, we will take a closer look at what to expect from both currency pairs today. First, it should be noted right away that traders often like to consolidate some of their positions in order to calmly leave for the weekend and take profits before that. Thus, movements against the direction of the trend are often observed on Friday. Of course, this does not happen every Friday, in our case this has not happened for two or three Fridays, which, on the other hand, increases the likelihood of a correction today. Secondly, GDP for the second quarter will be published today in the European Union, France, Spain and Italy, which, although unlikely to decline as much as the US GDP, may still lose enough. Most of all, we are interested in European GDP and the forecast for it -12% q/q and -14.5% y/y. This means that losses may reach 12% compared to the first quarter of 2020. And at 14.5% compared to the second quarter of 2019. If the real figures of this report are even worse, then the euro may begin to experience pressure on itself today. And the pound sterling could simply follow the EU currency, as they are still often correlated with each other. British GDP will be published as early as August 10 and does not bode well either, as the forecast is -20% q/q. In addition, a report on inflation in the European Union will be released, but we believe that it will have much less impact on the movement of both currency pairs. No important news in America and Great Britain for today.
What's on the chart:
Support and Resistance Price Levels - Levels that are targets when buying or selling. You can place Take Profit levels near them.
Red lines - channels or trend lines that display the current trend and show which direction it is preferable to trade now.
Arrows up/down - indicate when you reach or overcome which obstacles you should trade up or down.
MACD indicator is a histogram and a signal line, the crossing of which is a signal to enter the market. It is recommended to use in combination with trend lines (channels, trend lines).
Important speeches and reports (always contained in the news calendar) can greatly influence the movement of a currency pair. Therefore, during their exit, it is recommended to trade as carefully as possible or exit the market in order to avoid a sharp price reversal against the previous movement.
Beginners in the forex market should remember that every trade cannot be profitable. The development of a clear strategy and money management are the key to success in trading over a long period of time.


